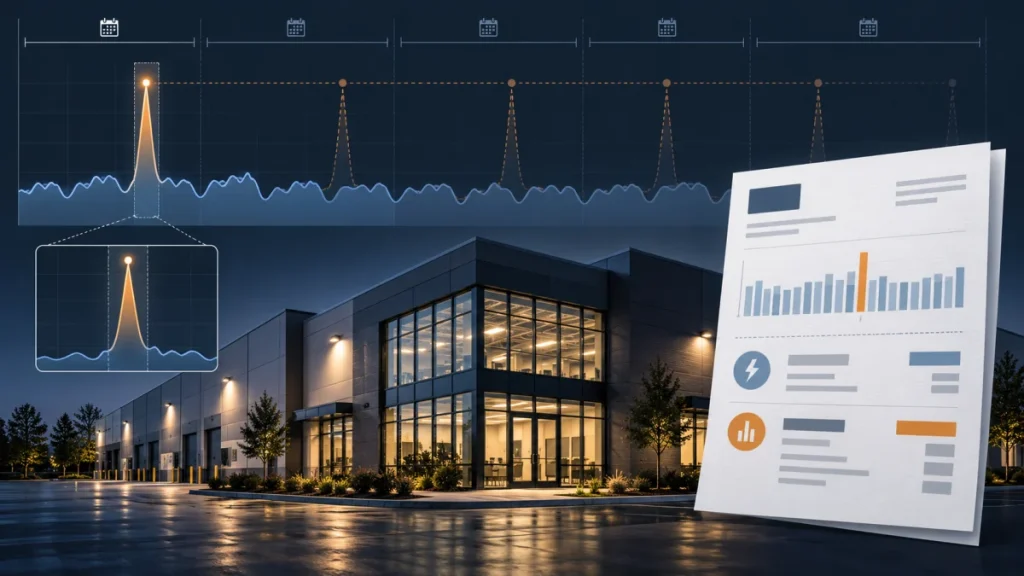

According to the 2026 Realtor.com Generational Housing Succession study, Baby Boomers and the Silent Generation are projected to release 13.9 million U.S. homes from older owner-occupancy between 2026 and 2036. That raises an obvious question: if younger Americans already struggle to afford today’s prices and mortgage rates, who is supposed to take all those houses?
The short answer is that there will not be one replacement generation, and many of the homes will not require a conventional buyer at the moment they leave older owner-occupancy.
Some will be inherited. Some heirs will move in; others will sell. Some homes will be bought by existing homeowners carrying equity from another property. Gen X and millennials already account for roughly half of current buyers and will be older during the coming handoff. Investors will buy a minority. Some properties will become rentals or spend time outside the open market. And where a motivated seller eventually faces too few buyers able or willing to pay the asking price, the remaining adjustment is straightforward: the price, financing terms, concessions, or timing of the sale have to change.
That is the part missing from much of the viral discussion.
A widely shared video asking who will buy Baby Boomers’ homes if Gen Z cannot afford them captures a real contradiction in the housing market. But the useful question is not whether one generation is to blame for another generation’s housing costs. It is how housing actually changes hands when the people holding a large share of the nation’s homes begin leaving them while the pool of financially capable buyers remains constrained.
The newest data suggest that transition is real, large and accelerating. They also suggest it will look much less like a single nationwide "silver tsunami" than a slow, uneven redistribution of homes across families, generations and local markets.
First, 13.9 Million "Released" Homes Does Not Mean 13.9 Million Listings
This distinction is essential.
The October 2026 Realtor.com Generational Housing Succession study estimates that Baby Boomers and the Silent Generation currently own and occupy about 36.7 million homes. By 2036, the model projects that number will fall to 22.8 million, a net decline of 13.9 million homes.
But Realtor.com does not define a released home as a home listed for sale.
Its model defines a release as the net number of homes vacated by older owner-occupant households because of death, a move into institutional care, household consolidation or a move to rental housing. The model tracks the decline in older owner-occupancy; it does not observe 13.9 million future MLS listings or 13.9 million completed sales.
That changes the framing immediately.
The question is not:
Who will buy 13.9 million boomer houses?
It is:
What happens to 13.9 million homes as older owner-occupants leave them, and which of those homes actually need a new buyer on the open market?
Realtor.com itself illustrates the uncertainty. It estimates about 1.27 million homes will be released in 2027. If only 44.8% of those homes reached the open market, that would be enough, all else equal, to restore the annual number of listings to its pre-pandemic level. The other half-plus could follow other paths.
The study also estimates that only about 16.9% of homes previously occupied by the aging population entered inheritance in 2025. That is useful context, but it still does not give us a complete national map of what happens to every released property.
The disposition of those homes is the real story.
The Handoff Is Large, but It Is Gradual
The 13.9 million figure is not a prediction that millions of homes will suddenly hit the market in one year.
Realtor.com projects annual releases rising from roughly 1.27 million homes in 2027 to 1.52 million in 2036, averaging about 1.39 million per year over the decade. Baby Boomers are projected to overtake the Silent Generation as the larger source of releases around 2029, and the Boomer release rate is still increasing when the forecast ends in 2036.
That means the true peak may come later.
An earlier Freddie Mac analysis of Baby Boomer homeowner retention reached a similar directional conclusion using a different model. Freddie Mac projected 9.2 million fewer Boomer homeowner households by 2035 and described the process as more like a rising tide than a sudden tsunami.
Those two numbers are not directly interchangeable. Freddie Mac modeled Baby Boomer homeowner households from an earlier starting point; Realtor.com‘s newer analysis includes both Baby Boomers and the Silent Generation and uses a different forecast window and methodology.
The common finding is more important than the headline difference:
Older owner-occupancy will decline materially, and the pace will accelerate as the large Boomer generation moves further into its 80s.
The Homes Being Released Are Not Mostly Starter Homes
The next important fact is what kind of housing is actually involved.
Realtor.com projects the 13.9 million releases this way:
| Home type | Projected releases, 2026-2036 | Share of total | Average annual release relative to recent listings |
|---|---|---|---|
| Starter homes, 0-2 bedrooms | 0.38 million | 2.7% | 3.2% |
| Family homes, 3-4 bedrooms | 9.9 million | 71.2% | 24.7% |
| Large homes, 5+ bedrooms | 3.6 million | 25.9% | 67.2% |
| Total | 13.9 million | 100% | 24.3% |
Source: Realtor.com Generational Housing Succession, 2026.
Only about 380,000 starter-sized homes are projected to be released over the entire decade. Nearly all of the projected handoff is concentrated in three-bedroom-and-larger homes.
That matters because the shortage faced by a first-time buyer is not simply a shortage of bedrooms somewhere in the United States. It is a shortage of homes in the right place, in usable condition, at a price and monthly payment that entry-level buyers can carry.
A five-bedroom house released in a slow-growth metro does not automatically solve a starter-home shortage in Los Angeles, New York or another expensive labor market. A $700,000 family home does not become affordable merely because its previous owner is 85. And an older house that needs substantial repairs may require even more cash after closing.
The coming handoff therefore creates more supply, but not necessarily the supply that the most constrained buyers need most.
So Who Actually Gets the Homes?
There is no national dataset that can responsibly assign each of the projected 13.9 million releases to one final destination. Any article claiming to know exact future shares would be guessing.
But the major pathways are clear.
| What happens after the older owner leaves? | Is an open-market buyer required immediately? | Likely market effect |
|---|---|---|
| Heir inherits and occupies the home | No | Ownership transfers without a normal sale |
| Heir inherits and later sells | Yes, at sale | Adds for-sale supply |
| Existing homeowner buys it | Yes | May free the buyer’s previous home |
| First-time buyer purchases it | Yes | Expands owner-occupancy |
| Investor purchases it | Yes | Often converts or keeps property as rental |
| Property becomes a rental without an immediate sale | Not necessarily | Adds or preserves rental supply |
| Property sits vacant or off-market temporarily | No | Delays the market adjustment |
| Seller cannot clear the market at the desired price | Not at that price | Price, concessions or timing must eventually adjust if a sale is required |
The important point is that the handoff is a housing-flow problem, not a simple one-for-one generational replacement.
Path 1: Existing Homeowners With Equity Buy Many of the Homes
The present market already shows why the buyer does not have to be Gen Z.
According to the National Association of REALTORS’ 2026 generational buyer survey, current buyers break down roughly as follows:
| Generation | Share of recent buyers |
|---|---|
| Baby Boomers | 42% |
| Millennials | 26% |
| Gen X | 25% |
| Gen Z | 4% |
| Silent Generation | 4% |
Reported generational shares may not sum to exactly 100% because of rounding.
First-time buyers made up only 21% of all buyers, the lowest share in NAR’s series.
The same report found Baby Boomers accounted for 55% of sellers as well as 42% of buyers. In other words, older Americans are not merely releasing homes. Many are also buying homes, often with decades of accumulated equity.
This creates a chain that viral arguments often ignore.
A Baby Boomer can sell a large suburban home to a Gen X household. That Gen X household may sell a smaller house to a millennial family. The millennial seller may free a condo or starter home for a first-time buyer.
That example is a mechanism, not a forecast of exact future shares. But it shows why a family-sized home does not have to pass directly from a 75-year-old owner to a 25-year-old first-time buyer for the transition to increase housing availability lower down the ladder.
Realtor.com‘s study makes the same point: roughly one million family homes per year are projected to be released on average, and additional trade-up opportunities could indirectly free starter homes even though older owners themselves are projected to release relatively few starter units.
There is a second reason existing owners have an advantage: equity.
A household selling a home with hundreds of thousands of dollars in accumulated equity is financing its next purchase from a very different starting position than a renter trying to assemble a first down payment while also qualifying at today’s mortgage rate.
That divide is especially important while mortgage rates remain high. As of October 8, 2026, Freddie Mac’s Primary Mortgage Market Survey put the average 30-year fixed mortgage rate at 7.40%, compared with 6.30% a year earlier.
sherafy.com has previously examined the related lock-in problem in depth: why most U.S. homeowners cannot simply take a low mortgage rate with them when they move. That structure suppresses mobility for owners with old low-rate mortgages while simultaneously making new borrowing more expensive for would-be buyers.
Path 2: Some Homes Are Inherited, So Nobody Buys Them at the Point of Transfer
Inheritance is the clearest reason the "who buys them?" question can be misleading.
A person can become the owner of a $700,000 house without ever qualifying for a $700,000 mortgage.
Cotality’s national deed analysis counted 340,000 inherited properties in the 12 months ending August 2025, equal to a record 7% of U.S. property transfers in its data.
After inheritance, several things can happen.
An heir can move into the home. Siblings can sell it and divide the proceeds. A beneficiary can keep it as a rental. A trust can hold it temporarily. A property can spend months in probate before entering the market.
Those outcomes have very different effects on housing supply.
If an heir occupies the house, ownership changed but no open-market buyer was required. If the heir sells it, the home becomes additional for-sale supply. If the heir rents it, the home may add to rental supply without creating a homeownership opportunity for another household.
This is why the projected decline in older owner-occupancy cannot simply be added to future listings.
Path 3: An Inherited House Can Become Purchasing Power Somewhere Else
Even when an heir does not keep the house, the housing wealth does not vanish.
Suppose three adult children inherit a paid-off home and sell it. The property returns to the market, but the sale proceeds also become financial assets held by the heirs. Some of that money may later become down payments, debt repayment, investments or purchases of other property.
We do not have evidence allowing us to say what share will flow back into housing, so it would be wrong to treat inheritance as a guaranteed future source of home-buying demand.
But the mechanism matters because it reveals a deeper fault line in future affordability.
The relevant divide may increasingly be not simply young versus old, but households connected to existing housing wealth versus households that are not.
A millennial or Gen Z adult who inherits property or sale proceeds approaches the housing market with a very different balance sheet from an otherwise similar renter whose family never owned appreciating real estate.
That can reproduce housing inequality inside the same generation even while trillions of dollars of property change hands over time.
Path 4: Gen X and Millennials Are Already a Much Larger Buyer Pool Than Gen Z
The viral framing also freezes younger generations at their current age and income.
The housing transition will not happen in 2026 alone.
NAR’s 2026 data already show Millennials at 26% of buyers and Gen X at 25%. Combined, those two generations represent just over half of recent buyers.
Over the coming decade, today’s younger buyers will be ten years older. Their incomes, family structures, savings, inherited assets and housing needs will change. Some current renters will become first-time owners. Some current owners will trade up. Some people will relocate to lower-cost markets.
That does not mean affordability automatically fixes itself with age. High prices, high rates, insurance costs, taxes and household incomes can continue to restrict demand.
It simply means a ten-year housing handoff cannot be modeled as though today’s 25-year-old buyer pool remains permanently 25.
No credible source currently tells us exactly what share of released older-owned homes will ultimately be purchased by Gen X, millennials or Gen Z. The defensible conclusion is narrower: the future buyer pool is larger and more dynamic than the viral Gen Z-versus-Boomer framing suggests.
Path 5: Investors Will Buy Some Homes, but They Cannot Absorb the Entire Handoff
Institutional investors matter in the U.S. housing market, especially in particular Sun Belt neighborhoods. But the data do not support the idea that large private-equity or institutional firms can simply become the buyer of last resort for America’s entire Boomer housing stock.
A 2026 Government Accountability Office investigation examined institutional ownership in Cincinnati, Dallas, Jacksonville, Nashville, Phoenix and Seattle. By 2024, institutional investors owned from less than 1% to 3% of all single-family homes in those metros. Their share of single-family rental homes was much higher in some places, reaching 22% in Jacksonville, which shows why their local effect can still be substantial.
A separate Realtor.com analysis of deed records found that investors meeting its definition of institutional scale accounted for about 1% of single-family home purchases nationally over the period it studied. Investors with fewer than 10 purchases made up more than 60% of investor purchases.
So two things can be true at once:
- Institutional investors can materially affect certain neighborhoods and rental markets.
- Their national footprint is far too small to explain who will absorb tens of millions of older-owned homes over time.
"Wall Street will buy them all" is not a serious national housing model.
Path 6: Some Sellers Will Eventually Have to Accept a Lower Price
This is the simplest part of the economics and often the most obscured part of the conversation.
A seller’s desired price is not guaranteed by the amount paid for the house, the amount still owed on the mortgage, a Zillow estimate, renovation costs or the owner’s retirement plan.
If a seller must sell and no financially capable buyer is willing to meet the asking price, something has to give.
That can mean:
- a price cut;
- seller-paid closing costs;
- repair credits;
- a mortgage-rate buydown;
- seller financing in some cases;
- a longer marketing period;
- withdrawal from the market;
- conversion to a rental;
- or simply waiting until conditions improve.
The seller’s financial position determines how quickly that adjustment happens.
A highly leveraged owner facing relocation may have little time. A retiree who owns the house outright may be able to wait for years.
That difference helps explain why a buyer shortage does not automatically produce an immediate housing crash.
We Already Have More Sellers Than Buyers, and Prices Have Not Collapsed
The current market offers a useful preview.
Redfin estimated that in August 2026 there were 58% more home sellers than buyers nationally, the widest gap in its records. In markets such as Nashville, Miami and Houston, sellers outnumbered buyers by more than two to one. Redfin classified August as the strongest buyer’s market in its series.
Yet prices did not immediately collapse.
In its August 2026 home-price index analysis, Redfin attributed continuing price resilience partly to homeowner equity: many sellers have little reason to accept a steep discount merely because the property takes longer to sell.
By September, however, more sellers were adjusting. Realtor.com’s September 2026 market report found:
- 20.8% of active listings had received a price cut, the highest share in nearly four years;
- active inventory had risen above 1.16 million homes;
- national inventory was only 9.1% below typical pre-pandemic levels;
- the stock of pending sales was down 4.1% year over year.
This is the mechanism in real time.
A market can have too many sellers relative to buyers without an instant crash because sellers can wait. But the longer weak demand persists, the more motivated sellers eventually compete through price or terms.
The Boomer housing handoff adds a demographic force to that same process.
Why So Many Older Owners Stay Put Even When Their Houses Are Large
The popular story often treats older households as irrationally "hoarding" homes that younger families need.
The incentives are more complicated.
A 2026 Redfin analysis of Census data found that empty-nest Baby Boomers living in one- or two-adult households own 28% of U.S. homes with three or more bedrooms, while millennial families with children own 16%.
That is a real mismatch between who has space and who is more likely to need it.
But the same research found 57.8% of Baby Boomer homeowners own their homes free and clear.
Realtor.com‘s generational succession data show the pattern becomes even stronger with age. Among owners ages 70 to 79 in its historical ACS sample, 72.8% of starter-home owners, 65.1% of family-home owners and 58.9% of large-home owners owned free and clear.
Downsizing can therefore mean exchanging a paid-off house for a smaller property that is surprisingly expensive, paying transaction costs, possibly taking on a new mortgage at a much higher rate, leaving a familiar neighborhood, or moving somewhere less suitable for aging.
For many owners, staying put is economically rational.
That is why the handoff accelerates much later than a simple retirement-age model would imply. Homeownership rates remain high through the 70s and begin falling more sharply in the 80s.
The Biggest Supply Effect May Be in Large Homes, Not Starter Homes
The segment math is striking.
Realtor.com projects an average 360,000 large homes with five or more bedrooms will be released annually over the coming decade. That annual release equals about 67% of the recent annual listing volume for large homes.
Not all of those homes will be listed, and they will not arrive in the same places at the same time. But the relative scale is much larger than in the starter-home market.
Large homes also come with a narrower potential buyer pool.
They generally require more purchasing power. They can carry higher property taxes, insurance, maintenance and utility costs. Many older homes need substantial updating. And household sizes have changed; not every younger buyer wants or can efficiently use a five-bedroom suburban property.
That is why the first visible price pressure from the generational handoff may emerge higher up the housing ladder in specific markets rather than as a sudden flood of cheap starter homes nationwide.
Geography May Matter More Than Generation
There is no single U.S. housing market.
A released house in a growing job center with constrained construction is not economically equivalent to the same house in a slow-growth metro losing population.
The National Association of Home Builders’ 2026 analysis of the housing "silver tsunami" identified Pittsburgh, Buffalo and Rochester as examples of metros where older populations combine with slow or negative population growth, creating greater risk that future turnover could outrun new demand.
By contrast, it identified places such as Durham-Chapel Hill, Knoxville and Jacksonville as better positioned to absorb additional supply, while markets such as Charlotte, Denver and Austin could benefit from more housing because stronger population growth creates continued demand.
That geographic mismatch may be one of the most important reasons a national crash is the wrong baseline expectation.
The same demographic release can produce:
- meaningful price softness in one metro;
- a healthier, more balanced market in another;
- and almost no affordability relief in a supply-constrained coastal market.
The outcome depends on local jobs, population growth, construction, taxes, insurance, housing condition, mortgage rates and the price at which sellers are willing to transact.
Household Growth Is Slowing at the Same Time the Handoff Is Accelerating
The supply story matters more because underlying household growth is also expected to slow.
The Harvard Joint Center for Housing Studies projects that the United States will add about 8.6 million households between 2025 and 2035, or roughly 860,000 per year. That would be less household growth than in any of the previous three decades.
From 2035 to 2045, the Center projects only 5.1 million additional households under its main scenario.
Those figures cannot be directly subtracted from the 13.9 million-home release estimate. One measures net household growth; the other models a decline in homes occupied by older owner households. They describe different things.
But together they point to a legitimate long-term question:
Will some local markets eventually have more family-sized housing coming available than financially capable households willing to absorb it at today’s relative prices?
NAHB’s metro-level work suggests that risk is greater in some slow-growth markets, while stronger-growth markets may absorb the turnover more easily.
That is why "who will buy them?" is ultimately a local demand question, not merely a generational one.
Why 9.2 Million and 13.9 Million Are Not Contradictory Forecasts
Readers researching this topic will encounter different "silver tsunami" numbers. The differences are easy to mistake for disagreement when they often reflect different definitions.
| Estimate | What it measures | Key limitation |
|---|---|---|
| 9.2 million fewer Boomer homeowner households by 2035 | Freddie Mac model of Baby Boomer homeowner retention | Boomers only; older forecast and different base year |
| 13.9 million homes released from older owner-occupancy, 2026-2036 | Realtor.com model covering Baby Boomers and Silent Generation | A release is not necessarily a listing or sale |
| 340,000 inherited properties in 12 months ending Aug. 2025 | Cotality deed observations | Measures actual inheritance transfers, not all aging-related releases |
| 58% more sellers than buyers in Aug. 2026 | Redfin estimate of current market balance | Snapshot of current active market, not demographic turnover |
The responsible way to read these figures is not to pick the largest number.
Each answers a different question.
Freddie Mac asks how Baby Boomer homeowner households decline over time. Realtor.com asks how many homes leave older owner-occupancy. Cotality measures actual inherited transfers. Redfin measures the balance between current sellers and buyers.
Together they describe different stages of the same housing system.
Will the Boomer Handoff Make Starter Homes Affordable Again?
Not by itself.
This may be the most important practical conclusion for younger buyers.
Realtor.com projects only 38,000 starter-home releases per year on average from Baby Boomers and the Silent Generation over the coming decade. That equals only about 3.2% of recent annual starter-home listings.
The direct effect on starter-home supply is therefore small.
There can be an indirect effect. More family-sized homes can make it easier for existing starter-home owners to trade up, releasing their smaller properties for the next buyer. But that chain depends on financing, local price differences and whether people can afford to move.
It also does not replace construction.
America’s housing shortage was built over many years through a combination of underbuilding, land-use constraints, construction costs, financing conditions and geographic job concentration. Older homeowners eventually leaving their houses can relieve some scarcity, but it cannot manufacture enough inexpensive housing in every high-demand market.
That is one reason housing construction remains central. sherafy.com‘s examination of why the United States still imports so much construction lumber from Canada illustrates the broader point: adding housing is not just a question of land. It requires an industrial supply chain of timber, mills, labor, transportation, financing, permitting and finished construction.
The country’s postwar housing expansion also helps explain why generational comparisons feel so stark today. Our earlier analysis of what actually caused the Baby Boom found that easier homeownership and rapidly expanding housing supply were part of a broader environment that made family formation unusually accessible for many households after World War II.
The coming handoff can redistribute existing houses. It cannot reproduce that environment by itself.
Will Home Prices Fall When Baby Boomers Age Out of Their Homes?
In some places and market segments, the evidence suggests additional supply should put downward pressure on prices relative to what they otherwise would have been. That is not the same thing as predicting a national crash.
The strongest evidence points toward three qualifications.
First, the process is gradual. The release rate rises over years and is still increasing at the end of Realtor.com‘s 2036 forecast.
Second, the additional supply is concentrated in family and large homes, not starter homes.
Third, the release is geographically mismatched with demand. Some slow-growth metros may face meaningful oversupply while faster-growing or severely supply-constrained markets continue to absorb homes readily.
A national median can therefore hide opposite local outcomes.
A five-bedroom home in Pittsburgh and a three-bedroom home in coastal California may both be part of the same demographic transition while facing entirely different buyer pools.
What Would Actually Cause a More Severe Housing Correction?
The generational handoff alone does not establish one.
The following is economic inference rather than a forecast from the demographic studies cited above. A more severe national correction would likely require several forces to reinforce one another, such as:
- a much larger increase in forced or highly motivated selling;
- materially weaker employment or household income;
- sustained high mortgage rates that keep financing demand suppressed;
- accelerated older-owner exits beyond current projections;
- large inventory growth in markets without matching population or income growth;
- or credit conditions that prevent otherwise willing buyers from qualifying.
Conversely, lower mortgage rates, stronger wage growth, new household formation, immigration, local job growth or constrained construction could absorb additional supply without large nominal price declines.
The central uncertainty is therefore not whether older Americans will eventually leave millions of homes. They will.
It is how quickly the homes arrive, where they are, what condition they are in, who has the balance sheet to take them, and what price clears each local market.
So Who Will Buy the Baby Boomers’ Homes?
The best answer is: many different people, and some homes will not be bought at the moment they leave older owner-occupancy at all.
Existing homeowners with equity are already a major buyer class. Gen X and millennials together account for roughly half of current purchases and will remain central to the market. Some homes will transfer through inheritance rather than sale. Investors will buy a minority, with much greater influence in some local markets than nationally. Some properties will become rentals. And where sellers eventually need to transact but the buyer pool cannot support the desired price, prices or terms will adjust.
What the data do not support is either extreme version of the story.
There is no evidence that Gen Z must personally finance 13.9 million Boomer homes at today’s prices for the market to function.
There is also no evidence that 13.9 million homes are about to flood the MLS and trigger one synchronized nationwide crash.
The more credible picture is a long generational housing handoff that redistributes existing housing wealth, increases family- and large-home supply, widens the importance of inheritance and existing equity, and puts the greatest price pressure on places where older-owner turnover eventually outruns financially capable local demand.
That process has already begun.
The question for the next decade is not whether America’s older homeowners will release more housing. The data strongly suggest they will.
The question is where the houses go, who can afford them, and what price finally brings each one into the next household’s hands.
References and Further Reading
Primary and Authoritative Housing Research
-
2026 Realtor.com Generational Housing Succession — Jiayi Xu, Realtor.com Economic Research. The central 2026 study estimating 13.9 million homes released from older owner-occupancy between 2026 and 2036, with separate projections for starter, family and large homes and a detailed methodology.
-
Aging Boomers and the Impact on the Housing Market Over the Next Decade — Freddie Mac. An earlier cohort-retention model projecting 9.2 million fewer Baby Boomer homeowner households by 2035 and explaining why the transition is expected to resemble a gradual tide rather than a single sudden wave.
-
Household and New Housing Unit Demand Projections for 2025-2035 and 2035-2045 — Harvard Joint Center for Housing Studies. Projects 8.6 million additional U.S. households between 2025 and 2035 and 5.1 million between 2035 and 2045 under its main scenario.
-
Baby Boomers Remain Largest Share of Home Buyers as First-Time Buying Falls to Record Low — National Association of REALTORS. Provides the 2026 generational composition of buyers and the record-low 21% first-time-buyer share.
-
Mortgage Rates: Primary Mortgage Market Survey — Freddie Mac. Weekly national mortgage-rate series; the 30-year fixed rate averaged 7.40% as of October 8, 2026.
Inheritance, Investors and Ownership Structure
-
A Frozen Tsunami: Why Inherited Homes Won’t Solve the Housing Crisis — Cotality. Reports 340,000 inherited U.S. properties in the 12 months ending August 2025, equal to 7% of observed property transfers.
-
Rental Housing: Institutional Investor Ownership of Single-Family Rental Homes — U.S. Government Accountability Office. Examines institutional ownership across six metros and finds institutional investors owned less than 1% to 3% of all single-family homes in those markets in 2024, while their share of single-family rentals was much higher in some locations.
-
The Shrinking Institutional Investor Footprint: National Trends and Local Concentration — Realtor.com Economic Research. Uses deed records to estimate that the largest institutional investors account for roughly 1% of national single-family purchases, with activity concentrated in particular markets.
Current Market Conditions and Geographic Effects
-
It’s Now the Strongest Buyer’s Market on Record, Driven by the Sun Belt — Redfin. Estimates that U.S. sellers outnumbered buyers by 58% in August 2026, with much larger imbalances in several Sun Belt metros.
-
U.S. Home Prices Rose 0.25% in August — Redfin. Explains why prices remained resilient despite weak buyer demand, including the role of homeowner equity and seller willingness to wait.
-
September 2026 Monthly Housing Trends — Realtor.com Economic Research. Reports 1.16 million active listings, a 20.8% price-cut share and a 4.1% year-over-year decline in pending inventory.
-
The Great Housing Mismatch: Empty Nesters Own 28% of the Nation’s Large Homes, Millennial Families Own 16% — Redfin analysis of Census data. Documents the mismatch in large-home ownership and reports that 57.8% of Baby Boomer homeowners own their homes free and clear.
-
Housing’s ‘Silver Tsunami’ Is Coming, But It Won’t Hit Every Market — National Association of Home Builders. Examines why older-owner turnover could produce oversupply in some slow-growth metros while being absorbed more easily in faster-growing markets.
Trigger and Further Context
- How Do Boomers Expect To Sell Their Houses If Gen Z Can’t Buy Them? — Casey Simpson. Viral video that frames the reader question examined here. It is useful as evidence of public interest, not as the factual basis for the housing analysis.
Editorial currency note: Housing inventory, mortgage rates, buyer-seller balance and price-cut data change frequently. This article reflects source data available through October 11, 2026. Long-run demographic projections are estimates, not guaranteed outcomes.