Electricity can get cheaper in the wholesale market while your electric bill gets more expensive because the electricity itself is only one part of what you are paying for.
In summer 2026, the U.S. Energy Information Administration forecast the average wholesale electricity price at about $45 per megawatt-hour. That works out to roughly 4.5 cents per kilowatt-hour. At the same time, EIA’s forecast for the average residential retail electricity price in 2026 was about 18.3 cents per kWh.
That sounds absurd at first.
How can electricity be worth roughly 4½ cents in the wholesale market and cost a household roughly 18 cents?
Because those numbers measure two different things.
The wholesale price is essentially the market price of electrical energy at a particular stage of the system. The residential price represents delivered electricity. EIA says its retail-price statistics include generation, transmission, distribution, taxes and fees.
And even that shorthand understates the complexity.
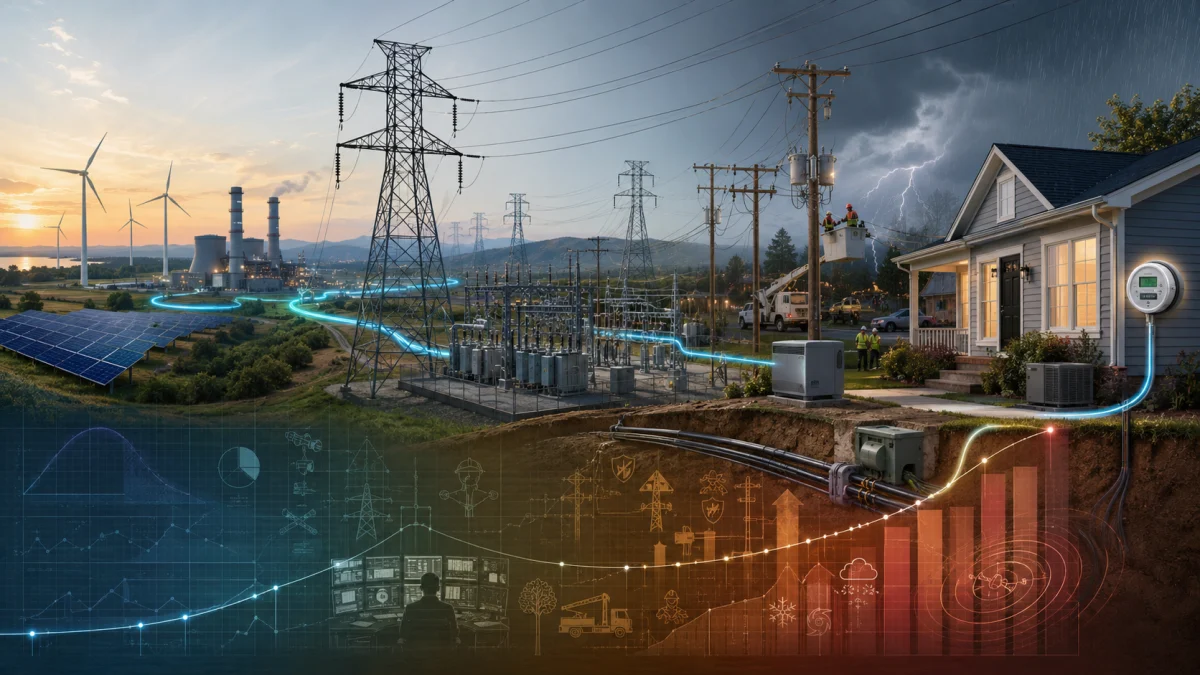
Your electric bill can be helping pay for power plants, reserve capacity, high-voltage transmission lines, neighborhood transformers, poles and wires, storm recovery, wildfire protection, financing costs, grid upgrades, regulatory programs and—in the case of investor-owned utilities—an authorized return on certain capital investments.
So the important distinction is this:
Your electric bill is not simply a receipt for the electricity you consumed. It is also a payment for maintaining an enormous system capable of delivering electricity whenever you demand it.
That is why falling wholesale electricity prices do not automatically produce falling household bills.
First, electricity really has become more expensive for households
The contradiction is not imaginary.
Lawrence Berkeley National Laboratory found that the average U.S. residential electricity price increased approximately 33% in nominal terms from 2019 through 2025. Residential prices rose faster than commercial and industrial prices over that period.
But there is an important qualification.
Inflation also rose substantially during those years. After adjusting for inflation, LBNL calculated that residential electricity prices increased about 5.6% from 2019 through 2025.
So two apparently contradictory statements can both be true:
- Residential electricity prices increased dramatically in dollar terms.
- Much—but not all—of that increase reflected broader inflation.
For households trying to pay the bill, of course, nominal dollars still matter. A 33% increase is money that has to come from somewhere.
But understanding the inflation-adjusted number prevents us from pretending electricity prices suddenly became one-third more expensive in real purchasing-power terms.
The 4.5-cent electricity and the 18-cent electricity are not the same product
This is the most important point in the article.
EIA’s summer 2026 wholesale forecast of about $45/MWh means approximately:
$45 ÷ 1,000 kWh = 4.5¢/kWh
But $45/MWh is not a national accounting estimate of what every kilowatt-hour costs to generate.
It is a wholesale market price.
Wholesale prices respond to supply, demand, fuel prices, weather, transmission constraints and which generator is needed to meet the next increment of demand. EIA notes that natural-gas plants frequently determine the marginal wholesale price and that additional solar and wind generation can reduce wholesale prices in some circumstances by reducing the need to operate more expensive generators.
Retail electricity is different.
EIA calculates average retail electricity prices from the revenue collected by utilities and electricity providers divided by the electricity they sell. Those revenues cover the broader cost of providing retail service.
So comparing 4.5 cents with 18.3 cents is useful precisely because the numbers are not apples to apples.
The gap tells us there is much more between a wholesale electricity market and the outlet in your kitchen.
What does an electric bill actually pay for?
There is no single national breakdown because utilities, states and electricity markets are organized differently.
One utility may display generation and delivery separately. Another may bundle several expenses together. Some states have competitive retail electricity suppliers. Others have vertically integrated regulated utilities.
But the major economic layers look something like this:
| Cost | What you are actually paying for |
|---|---|
| Energy / fuel | The electricity generated or purchased and the fuel used to produce it |
| Generation investment | Construction, financing and maintenance of power plants |
| Capacity / reliability | Resources that must be available even when they are not producing electricity |
| Transmission | High-voltage lines and substations moving bulk electricity long distances |
| Distribution | Local substations, transformers, poles, wires, meters and neighborhood infrastructure |
| Grid hardening | Wildfire mitigation, storm protection, vegetation management and resilience investments |
| Capital recovery / financing | Long-lived infrastructure being paid for over many years |
| Programs and adjustments | Fuel riders, efficiency programs, low-income programs and other jurisdiction-specific charges |
| Taxes and fees | State, local and other applicable charges |
Not every customer pays every category as a separate line item.
But collectively, this is why the market value of a megawatt-hour is not the same thing as the cost of providing reliable residential electric service.
You are paying for electricity that may never be generated
This sounds strange, but it is essential to understanding the grid.
The electricity system cannot simply produce enough power to meet average demand.
It needs enough resources to survive the worst hours.
Imagine a region where ordinary demand is 20 gigawatts but electricity usage can climb toward 30 gigawatts during a brutal heat wave.
The system cannot build for 20 GW and hope everybody turns off their air conditioner when demand reaches 21.
Some generating resources therefore have economic value simply because they are available when needed.
Several major U.S. electricity markets—including PJM, ISO New England, NYISO and MISO—operate formal capacity markets. FERC explains that capacity payments compensate resources for committing to be available in the future. They are separate from payments for the electricity actually generated. Utilities and load-serving entities pay those capacity costs, which are ultimately passed through to consumers.
Other regions handle resource adequacy differently, but the underlying problem exists everywhere:
Reliability costs money even when the backup resource is sitting idle.
That cost is largely invisible if all you look at is a wholesale energy price.
The wires are becoming a much bigger part of the story
One of the strongest explanations for rising electricity costs is not what is happening at power plants.
It is what is happening between the power plant and your house.
A 2026 Lawrence Berkeley National Laboratory study examined distribution spending by investor-owned utilities and found that inflation-adjusted distribution spending had increased about 6% per year since 2014—roughly four times the rate of growth during the preceding 20 years.
Most of that increase was capital spending rather than day-to-day operating expenses.
Even more striking, LBNL estimated that, on a per-kWh basis, rising investor-owned utility distribution costs since 2014 represented more than 30% of the increase in the national-average retail electricity rate over that period.
Distribution is the decidedly unglamorous part of the electricity system:
transformers, substations, local wires, poles, meters, vegetation management, equipment replacement, grid controls and everything else required to get power through the final miles to a customer.
A solar farm can produce cheaper electricity without making a 50-year-old neighborhood transformer younger.
Cheap natural gas does not replace a failing substation.
A windy afternoon does not repay the bonds used to rebuild a storm-damaged distribution system.
That is one of the central reasons wholesale and retail prices can move in opposite directions.
Wholesale prices can move quickly. Utility costs can last for decades.
Wholesale electricity prices are highly responsive.
Natural-gas prices fall.
Hydropower production rises.
Demand drops.
More low-cost generation becomes available.
Wholesale electricity can become cheaper almost immediately.
Infrastructure costs do not behave that way.
Suppose a utility spends $2 billion upgrading transmission and distribution equipment.
Customers are generally not charged $2 billion in the month construction finishes. Regulators may instead allow the investment to be recovered through electricity rates over many years.
For investor-owned utilities, approved rates can also include an authorized return on qualifying investment. EIA defines an investor-owned utility as a rate-regulated private utility authorized to achieve an allowed rate of return.
That means today’s electric bill can be paying for yesterday’s capital project.
And tomorrow’s bill can still be paying for it even if wholesale power becomes extremely cheap.
This creates two different clocks:
Wholesale electricity: minutes, hours, days and seasons.
Utility infrastructure: years and decades.
Once you understand that mismatch, the apparent paradox begins to disappear.
So what is actually causing electricity prices to rise?
There is no single national answer.
That may be the most important conclusion from the evidence.
LBNL examined the 30 states where inflation-adjusted average electricity prices rose by more than 2% from 2024 to 2025 and identified the major stated drivers appearing in regulatory filings, tariffs, market data and other sources.
The results looked like this:
| Identified driver | States where it was identified |
|---|---|
| Fuel / wholesale supply | 21 |
| Distribution costs | 16 |
| Generation capital spending | 11 |
| Transmission costs | 11 |
| Storm-cost recovery | 9 |
| Capacity-market prices | 7 |
| Extreme inflation | 6 |
| Clean-energy policy | 5 |
| Wildfire costs | 2 |
| Other | 2 |
This table deserves careful interpretation.
It does not mean fuel caused 21/30ths of the national increase or that distribution caused 16/30ths. Multiple factors can apply to the same state, and LBNL explicitly warns that year-to-year drivers can change because of the peculiarities of state ratemaking.
But it demonstrates something important:
The evidence does not support a single-cause explanation for America’s rising electricity prices.
Sometimes fuel is the major issue.
Sometimes it is distribution investment.
Sometimes transmission.
Sometimes storm recovery.
Sometimes capacity prices.
Sometimes clean-energy policy contributes.
Sometimes wildfire mitigation does.
Usually several things are happening simultaneously.
That makes slogans such as “renewables made electricity expensive” or “renewables are cheap, therefore electricity should be cheap” poor descriptions of how retail electricity pricing actually works.
If solar and wind are cheap, why don’t electric bills automatically get cheaper?
Because the cost of generating electricity and the cost of operating an electricity system are not interchangeable concepts.
Solar and wind have an obvious economic advantage once constructed: they do not have to continuously purchase coal or natural gas to generate electricity.
When abundant low-marginal-cost generation enters a wholesale market, it can push wholesale energy prices downward. EIA explicitly notes that additional solar and wind generation can reduce the need for more expensive generators in some circumstances.
That can save consumers money.
But it does not make the rest of the electric system free.
Depending on the location and circumstances, a changing generation mix may also require:
- new transmission;
- interconnection upgrades;
- storage or flexible resources;
- additional reliability capacity;
- changes to grid operations.
Meanwhile, customers may still be paying for older generating plants and previously approved infrastructure.
And none of this eliminates the cost of distribution, storm recovery, wildfire mitigation or local grid replacement.
The reverse argument is equally incomplete.
If a state with substantial renewable generation has expensive electricity, that does not prove renewables caused the high price. California, for example, has one of the country’s most renewable-heavy electricity systems and one of its highest retail prices—but California also has unusually large infrastructure, wildfire and other utility costs.
The relevant question is not:
“Is this state renewable?”
It is:
“What costs are actually being recovered through this state’s electricity rates?”
That answer has to be investigated state by state.
Data centers are becoming impossible to ignore
For years, U.S. electricity demand barely grew.
That era appears to be ending.
FERC’s 2025 State of the Markets analysis estimated that more than 50 gigawatts of data-center capacity was already in service by the end of 2025, representing approximately 24% compound annual growth since 2020.
EIA’s 2026 forecasts increasingly identify data centers as an important source of electricity-demand growth. Its August 2026 outlook said U.S. generation was rising to meet growing data-center demand.
That raises an obvious question:
Are households paying for grid upgrades needed by data centers?
Sometimes they potentially can—but data centers do not automatically make residential rates go up.
That distinction matters.
A 2026 Lawrence Berkeley National Laboratory analysis identified three factors that determine how new commercial and industrial electricity demand affects prices:
- How much unused capacity already exists
- How expensive it is to expand the system
- Who is required to pay for that expansion
Imagine a grid that already has spare capacity.
A new data center begins using enormous amounts of electricity and pays rates that fully cover its costs.
The grid’s fixed expenses can now be spread across more electricity sales.
In that scenario, additional demand could actually lower the average rate required from other customers.
Now imagine the opposite.
A gigantic data-center project requires new generators, substations and transmission lines. The utility spends billions preparing for it. Regulators allow much of that cost to enter the general rate base. Then the project uses less electricity than projected—or never gets built.
Residential customers could end up carrying some of the cost.
That is why utilities and regulators are increasingly developing special large-load tariffs with minimum payments, longer contractual commitments and other protections.
An August 2026 LBNL review examined 55 large-load tariffs and specifically highlighted the risk of underused infrastructure investments affecting other customers.
So “AI is making your electricity expensive” is too broad.
But “who is paying for the infrastructure required by enormous new data-center loads?” is becoming one of the most important electricity-rate questions in America.
Electricity can cost almost four times as much in one state as another
If one national factor controlled electricity prices, state prices should look much more alike.
They do not.
EIA’s year-to-date data through June 2026 showed:
| Location | Average residential electricity price |
|---|---|
| U.S. average | 18.16¢/kWh |
| North Dakota | 12.19¢/kWh |
| Massachusetts | 30.06¢/kWh |
| California | 33.17¢/kWh |
| Hawaii | 45.95¢/kWh |
A residential kilowatt-hour in Hawaii therefore cost almost four times what it cost in North Dakota.
That enormous spread cannot be explained by one technology.
States differ in:
- fuel availability;
- generation mix;
- transmission access;
- geography;
- weather;
- customer density;
- utility ownership;
- regulatory systems;
- historical capital investments;
- storm exposure;
- wildfire exposure;
- taxes and public programs;
- demand growth;
- how costs are distributed among residential, commercial and industrial customers.
Even neighboring utilities can have meaningfully different rates.
There is no single American electric bill.
What would a $180 electric bill look like at the wholesale price?
This is where the difference becomes tangible.
At EIA’s forecast 2026 residential price of 18.3¢/kWh, a $180 electricity bill corresponds to roughly:
984 kWh of electricity
Now value 984 kWh at the 4.5¢/kWh wholesale-price example:
984 × $0.045 ≈ $44
So you have:
Rough wholesale-market value of the energy: about $44
Residential bill at 18.3¢/kWh: about $180
The approximately $136 difference is not “utility profit.”
It also cannot honestly be divided into one universal national pie chart saying that X% is transmission, Y% is distribution and Z% is taxes.
Different utilities recover costs differently.
And the 4.5-cent wholesale figure itself does not represent the complete fixed and capital cost of every generator supplying the system.
But the example illustrates the scale of what households frequently misunderstand:
Most of the economic system behind your electric bill cannot be explained simply by asking what one kilowatt-hour is trading for in the wholesale energy market.
That is the gap between the power market and the power bill.
Why is my electric bill higher?
There is another complication.
A higher bill does not necessarily mean your electricity rate increased.
Your bill is roughly:
electricity used × effective electricity price + fixed charges
So your bill can rise because:
- you used more electricity;
- your rate increased;
- fixed charges increased;
- your time-of-use pattern changed;
- a fuel or regulatory adjustment changed;
- or several of those things happened together.
If you want to know why your own bill increased, start with the same month last year.
1. Compare kilowatt-hours, not dollars
Find the total kWh used on both bills.
If you used 25% more electricity because of a heat wave, new air conditioner, electric vehicle or other load, much of the mystery may already be solved.
2. Calculate your effective price per kWh
Divide your total electricity charges by the number of kWh used.
For example:
$180 bill ÷ 1,000 kWh = 18¢/kWh
Now perform the same calculation for last year’s bill.
If your usage remained similar but your effective price rose from 15¢ to 18¢, the rate structure changed materially.
3. Separate electricity supply from delivery
If your utility itemizes them, compare:
- generation or supply;
- transmission;
- distribution;
- fixed customer charges;
- riders and adjustments;
- taxes and fees.
This can immediately reveal whether the increase came from the electricity itself or from delivering it.
4. Look for a recent rate case
For regulated utilities, search your state public utility commission for your utility’s latest rate case.
Do not stop at the utility’s press release.
The regulatory filing or commission order should explain what revenue increase was requested, what regulators approved and what costs were cited.
EIA notes that regulated investor-owned utilities generally seek rate increases when they expect existing rates will not provide enough revenue to recover allowed operating costs, investments and authorized returns.
5. Check your rate plan
Time-of-use customers may pay substantially different rates depending on when they consume power.
A household can therefore use approximately the same total electricity while paying more because more consumption shifted into expensive peak periods.
That is particularly relevant for air conditioning, electric vehicles, pool equipment and electric heating.
So are electric bills rising because electricity generation is expensive?
Sometimes.
But that is not the complete answer.
Fuel and wholesale supply were actually the most frequently identified recent price driver in LBNL’s state review, so it would be wrong to dismiss generation costs.
It would be equally wrong to pretend generation explains everything.
Distribution investment has risen rapidly.
Transmission costs matter.
Capacity costs matter.
Storms matter.
Wildfire mitigation matters in some places.
Infrastructure financing matters.
Clean-energy policies can increase some costs while low-cost renewable generation can reduce others.
And enormous new electricity users such as data centers are forcing regulators to decide who should pay for the next generation of grid infrastructure.
The electric system is moving through all of those changes simultaneously.
The bottom line
Electricity bills can rise while wholesale electricity gets cheaper because a household does not buy wholesale electricity.
It buys reliable, continuously available electricity delivered through a massive physical system.
The commodity at the center of that system may be cheap at a particular moment. The infrastructure surrounding it may be getting more expensive.
That is how EIA could forecast wholesale electricity at roughly 4.5 cents per kWh during summer 2026 while forecasting an average residential retail price of about 18.3 cents per kWh.
There is no contradiction once you understand what the two prices measure.
And there is no honest single national villain.
If you want to know why electricity is expensive where you live, the answer is not sitting in a national talking point about fossil fuels, renewable energy, utility profits or artificial intelligence.
It is sitting in your utility’s cost structure, its rate cases, its grid investments, its fuel and power purchases—and in the regulatory decisions that determine which customers pay for them.
That is what is really hiding inside the price of one kilowatt-hour.
References and Further Reading
U.S. electricity prices and wholesale markets
-
U.S. Energy Information Administration — Short-Term Energy Outlook — EIA’s current short-term forecasts for U.S. wholesale and residential electricity prices, generation and demand.
-
U.S. Energy Information Administration — Electric Power Monthly, residential prices by state — Monthly and year-to-date residential electricity price data used for the state comparisons in this article.
-
U.S. Energy Information Administration — Does EIA publish electricity sales and price data by state and utility? — Explains how EIA calculates average retail prices and what those figures include.
-
U.S. Energy Information Administration — Prices and factors affecting electricity prices — Background on generation, fuel, weather, transmission, distribution and regulation.
Retail-price trends and utility costs
-
Lawrence Berkeley National Laboratory — Retail Electricity Price Trends and Drivers: Data Update, 2026 Edition — Detailed state and national analysis of retail-price changes and the factors associated with them.
-
Lawrence Berkeley National Laboratory — Electric Utility Distribution Costs: Scoping Study on Trends, Drivers, and Possible Response Strategies — Analysis of rapidly rising distribution spending and its contribution to retail electricity rates.
Electricity-market structure and capacity
-
Federal Energy Regulatory Commission — Wholesale Electricity Markets: Overview and Guide — Explains the distinction among wholesale energy, capacity and ancillary-service markets.
-
Federal Energy Regulatory Commission — Understanding Wholesale Capacity Markets — Explains why some generators are paid for availability even when they are not actively generating electricity.
Data centers and electricity demand
-
Federal Energy Regulatory Commission — 2025 State of the Markets Report — Includes FERC staff’s analysis of rapid load growth and more than 50 GW of in-service U.S. data-center capacity by the end of 2025.
-
Lawrence Berkeley National Laboratory — Revisiting the Relationship Between Demand Growth and Electricity Prices — Explains why new electricity demand can either raise or lower rates depending on capacity utilization, system-expansion costs and cost allocation.
-
Lawrence Berkeley National Laboratory — Electricity Rate Designs for Large Loads: 2026 Update — Examines how utilities and regulators are designing rates for data centers and other large loads while attempting to limit cost shifting and stranded-investment risks.
Editorial currency note: Electricity prices, utility tariffs, rate cases and EIA forecasts change regularly. State price figures in this article use EIA data available through June 2026 and released in August 2026. Forecast figures reflect EIA’s 2026 Short-Term Energy Outlook releases available at the time of publication.