
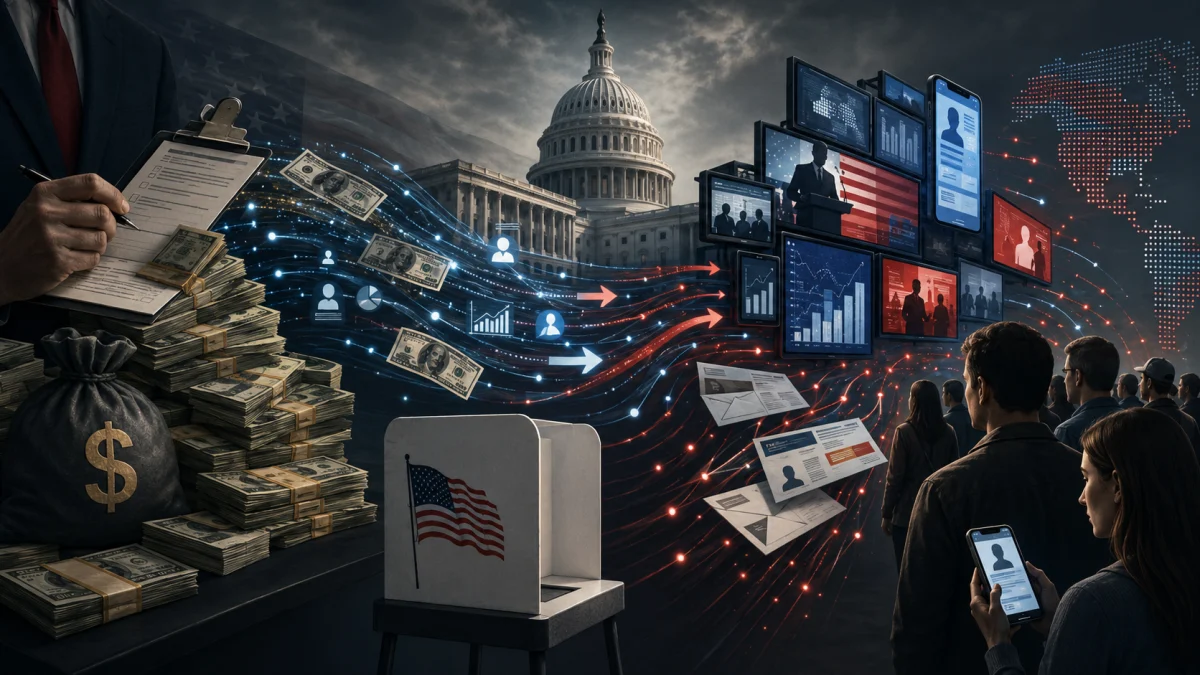
Outside political spending does not reliably buy elections. But it can buy something more fundamental: a disproportionate share of the information voters see before they make their choice. A cross-case analysis of Democratic primaries from 2020 through 2026 helps explain when that advantage matters—and why losing a candidate does not necessarily mean voters rejected that candidate’s policies.
Data and election results reviewed through August 13, 2026.
In 2022, Rep. Ilhan Omar came within 2.15 percentage points of losing the Democratic primary for her Minneapolis-area congressional seat. She received 50.35% to Don Samuels’ 48.20%.
Two years later, Omar defeated the same opponent 56.23% to 42.91%.
Then, in August 2026, Omar received 80.71% of the primary vote. Her nearest opponent received just 6.71%. (Minnesota Secretary of State)
The transformation is dramatic:
+2.15\text{ points} \;\rightarrow\; +13.32\text{ points} \;\rightarrow\; +74.00\text{ points}
But Omar’s trajectory is more useful as a warning than as an explanation. The 2026 field was completely different from the Samuels races. Candidate strength changed. The political environment changed. Campaign resources changed. And the extraordinary outside-spending offensives seen in several other Democratic primaries were not replicated at comparable scale.
The larger question is therefore not why one politician won one election.
It is:
How much does outside political spending change election outcomes—and can it help explain why voters sometimes support progressive policies much more strongly than they support the candidates associated with them?
After examining races in which millions of outside dollars helped progressives, hurt progressives, failed spectacularly, coincided with landslide defeats and landed in elections decided by only hundreds of votes, the evidence points toward a more precise answer.
Money does not mechanically buy votes. It buys opportunities to shape the information environment in which votes are cast.
That distinction matters.
An election result tells us whom voters selected from the candidates placed before them after months of advertising, media coverage, endorsements, scandals, fundraising, opposition research and strategic messaging.
It does not provide a clean measurement of what those voters believe about every policy associated with the winner or loser.
That difference is the electoral information gap.
Election Results Are Not the Same Thing as Political Beliefs
American political analysis routinely treats candidate elections as ideological referendums.
A progressive loses, and the conclusion becomes that voters rejected progressive politics.
A moderate wins, and the electorate supposedly demanded moderation.
A Republican wins a state by 15 points, and the state is described as rejecting policies associated with Democrats.
Actual ballot results make that interpretation much harder to defend.
Consider Missouri in 2024.
Voters were asked to decide Proposition A, which increased the state minimum wage and established earned paid sick leave requirements. The official ballot language called for a $13.75 minimum wage in 2025, $15 in 2026 and subsequent inflation adjustments, while also requiring covered employers to provide earned paid sick leave. (Missouri Secretary of State — 2024 Ballot Measures)
The measure passed:
1,693,064 YES
1,247,658 NO
or:
57.6% support
(Missouri Secretary of State — 2024 General Election Results)
In that same statewide election, Kamala Harris received 1,200,599 presidential votes, or 40.1% of the Missouri presidential vote.
The descriptive difference is:
57.6 − 40.1 = 17.5 percentage points
Nebraska provides an even more dramatic example.
Initiative Measure 436 established a right for eligible employees to earn paid sick time, with annual limits of 40 or 56 hours depending on employer size. Nebraska voters approved it by 662,348 to 225,974. (Nebraska Secretary of State — 2024 General Election Canvass Book)
That works out to approximately:
74.6% support
Yet Harris received only 369,995 of Nebraska’s 952,182 presidential votes—approximately 38.9%.
The difference:
74.6 − 38.9 = 35.7 percentage points
| 2024 electorate | Policy result | Harris presidential share | Descriptive policy–candidate gap |
|---|---|---|---|
| Missouri — minimum wage and paid sick leave | 57.6% | 40.1% | +17.5 points |
| Nebraska — paid sick leave | 74.6% | 38.9% | +35.7 points |
This does not mean every Missouri or Nebraska voter who supported those measures wanted a progressive member of Congress. It does not mean Harris was the ideological equivalent of the ballot measures. And because participation can differ between ballot questions and candidate races, the figures should not be interpreted as individual-level voter switching.
They establish a narrower but important fact:
An electorate can overwhelmingly support an individual policy commonly associated with the economic left while simultaneously rejecting the Democratic candidate on the same ballot.
National polling shows the same general phenomenon.
Pew Research Center found in 2025 that 63% of Americans favored raising tax rates on large businesses and corporations, while 58% favored raising rates on household income above $400,000. Gallup found 68% approval of labor unions in 2025, including 69% among independents. (Pew Research Center) (Gallup)
None of those figures prove that 60% or 70% of Americans are “progressives.”
They demonstrate something more useful:
Policy Preference ≠ Candidate Preference
Candidate elections bundle dozens of considerations together.
A voter may support paid sick leave and dislike a Democratic presidential candidate. Another may favor higher corporate taxes but oppose a progressive congressional candidate because of foreign policy, crime, personality, immigration, local representation or a negative advertisement they saw six times that week.
This is the first piece of the puzzle.
What Does Political Money Actually Buy?
The phrase “buying an election” is rhetorically powerful but analytically sloppy.
A Super PAC cannot legally walk into a polling place and purchase 50,000 ballots.
What money can purchase is communication.
Television advertising. Streaming video. Direct mail. Digital ads. Search advertising. Social media. Consultants. Message testing. Voter targeting. Polling. Opposition research. Phone banking. Production. Repetition.
That leads to a more useful causal sequence:
Outside Spending → Information Advantage → Candidate Perception → Vote
Political-science research supports taking this mechanism seriously without pretending that every advertisement works. Recent research specifically examining presidential-primary advertising finds measurable persuasive effects from campaign advertising while also showing why the problem is statistically difficult: campaigns strategically choose where, when and against whom to spend. (Political Science Research and Methods)
That strategic targeting produces one of the biggest traps in campaign-finance analysis.
Suppose candidates subjected to $10 million in negative outside spending lose unusually often.
It would be tempting to conclude:
$10 million → Loss
But major political organizations do not randomly choose candidates to attack.
They tend to invest where there is a reason to believe the election can move.
The actual structure can therefore look like:
\text{Candidate vulnerability} \;\rightarrow\; \text{Outside spending}
while simultaneously:
\text{Candidate vulnerability} \;\rightarrow\; \text{Election loss}
A naïve comparison can mistakenly attribute preexisting vulnerability to the money that arrived because donors already recognized that vulnerability.
Economist Steven Levitt demonstrated the seriousness of this problem decades ago. His 1994 study used repeat congressional matchups to hold candidate and district characteristics more constant. Once those fixed differences were addressed, estimated campaign-spending effects became dramatically less impressive than simple cross-sectional comparisons suggested. (Steven D. Levitt — Journal of Political Economy)
So a serious analysis needs more than a headline saying one side spent $10 million and the other side lost.
It needs contradictions.
Fortunately, American primaries provide plenty of them.
The Outside-Spending Experiment: When Millions Won, Lost and Failed
Several high-profile Democratic primaries from 2020 through 2026 provide unusually useful comparisons because the financial interventions were so large.
They do not form a randomized experiment, and this article does not pretend they do. They function as comparative cases: elections that allow competing theories about political spending to be tested against outcomes that sometimes support them and sometimes sharply contradict them.
| Race | Financial environment | Result | Analytical significance |
|---|---|---|---|
| Jamaal Bowman vs. George Latimer, 2024 | AIPAC-affiliated United Democracy Project reported roughly $14.6 million in independent expenditures tied to the race by its late-primary filings. | Latimer defeated Bowman. | Massive outside advantage coincided with progressive defeat. |
| Cori Bush vs. Wesley Bell, 2024 | UDP reported about $8.44 million in election-related independent expenditures by July 30. | Bell 63,521; Bush 56,723. | Another high-spending defeat, but against a credible local challenger. |
| Donna Edwards vs. Glenn Ivey, 2022 | UDP spent about $4.26 million against Edwards and $1.7 million supporting Ivey. | Ivey 51.77%; Edwards 35.22%. | Large asymmetric intervention and decisive defeat. |
| Jessica Cisneros vs. Henry Cuellar, 2022 | UDP spent about $1.43 million against Cisneros and $423,000 supporting Cuellar. | Cuellar survived the recount by 289 votes. | Relatively small persuasion effects could have changed the winner. |
| Summer Lee vs. Steve Irwin, 2022 | UDP filings showed roughly $1.77 million tied to the PA-12 effort by May 6, before the May 17 primary. | Lee 41.9%; Irwin 41.0%. | Heavy outside opposition did not defeat the progressive. |
| Carrick Flynn vs. Andrea Salinas, 2022 | Crypto-linked Protect Our Future had reported nearly $7 million supporting Flynn by April 19. | Salinas 36.6%; Flynn 18.6%. | Enormous financial support failed to manufacture viability. |
| Marie Newman vs. Dan Lipinski, 2020 | Of about $1.6 million in outside spending immediately before the election, all but roughly $150,000 favored Newman or opposed Lipinski. | Newman won the rematch. | Outside financial advantage can work for a progressive too. |
| Abdul El-Sayed vs. Haley Stevens, 2026 | Outside groups backing Stevens ultimately spent more than $60 million, including more than $30 million from AIPAC and affiliates. | El-Sayed won by less than one point. | One of the clearest modern demonstrations that extraordinary spending does not guarantee victory. |
The underlying election and spending records come from state election authorities, Federal Election Commission filings and contemporaneous reporting. (New York State Board of Elections)
There is no simple monotonic relationship in this table.
Big-money candidates win.
Big-money candidates lose.
Progressives survive expensive attacks.
Progressives lose after expensive attacks.
A progressive can receive the outside advantage and defeat an incumbent.
A candidate can receive nearly $7 million in support and finish below 20%.
And in Michigan in 2026, a progressive Senate candidate survived more than $60 million in outside spending supporting his principal opponent. AP reported that more than $30 million came from AIPAC and affiliated organizations. (Associated Press)
That single race is enough to reject any serious model resembling:
Most Money → Automatic Victory
The data require something more sophisticated.
The Variable That Matters More Than Gross Spending
Imagine two elections.
In Election A, an outside organization spends $5 million against a congressional candidate while that candidate and supportive groups collectively have $15 million available to respond.
In Election B, the same organization spends $5 million against a candidate whose entire campaign and supporting network can spend only $1 million.
The headline is identical:
“Super PAC spends $5 million.”
The actual information environments are radically different.
That is why gross spending is a weak measure of political power.
A better concept is net information advantage.
For a target candidate i, define the net outside spending imbalance:
E_i = (\text{Pro-opponent} + \text{Anti-target}) - (\text{Pro-target} + \text{Anti-opponent})
A positive number means the outside environment favors the target candidate’s opponent.
A negative number means the outside environment favors the target.
But $5 million in a 50,000-voter primary is not equivalent to $5 million in an election with 500,000 voters.
So normalize the imbalance by turnout:
A_i = \operatorname{sgn}(E_i)\,\ln\!\left(1 + \frac{\lvert E_i\rvert}{N_i}\right)
where N_i is the number of primary voters.
The logarithm accounts for diminishing returns. Going from $100,000 to $1 million may transform a campaign’s communication capacity. Going from $20 million to $20.9 million probably does not have the same proportional effect.
Candidate resources should then be measured separately:
K_i = \ln\!\left(\frac{\text{Opponent campaign spending}+1}{\text{Target campaign spending}+1}\right)
That distinction matters because an independent expenditure and the candidate’s own campaign spending are legally and operationally different, even when both ultimately compete for voter attention.
The underlying question becomes less sensational and more measurable:
How lopsided was the political information market actually experienced by the electorate?
Information-Market Share May Be Even More Important
There is another way to think about the same problem.
Suppose $10 million worth of paid political communication reaches an electorate and one outside interest is responsible for $5 million.
Its rough information-market share is:
H_i = Hostile Outside Paid Media ÷ All Paid Political Media in Race
In this simplified example:
H_i = 0.50
Now put the same $5 million into a race with $40 million in total political communication.
Its share falls to:
H_i = 0.125
Same organization.
Same dollars.
Completely different potential saturation.
This does not mean every dollar produces equal impressions, that every impression reaches a unique voter, or that all messages are equally persuasive. A rigorous implementation would ideally use advertising impressions rather than merely expenditures.
But it gets much closer to the democratic question that actually matters:
What portion of the paid information reaching voters was financed by one side of the contest?
That is a better description of political power than a raw dollar total.
Why Close Elections Change the Mathematics
The 2022 Democratic runoff between Rep. Henry Cuellar and progressive challenger Jessica Cisneros demonstrates why even modest persuasion effects can matter enormously.
United Democracy Project spent approximately $1.43 million opposing Cisneros and another $423,000 supporting Cuellar. After a recount, Cuellar won by 289 votes. (Texas Tribune)
Roughly 45,500 ballots were cast for the two candidates.
A 289-vote margin represents only about:
\frac{289}{45{,}500} \approx 0.64\%
And because a voter switching directly from Cuellar to Cisneros changes the margin by two votes, roughly 145 direct vote switches would have been enough to reverse a 289-vote two-candidate margin.
That does not establish that UDP advertising supplied those votes.
It establishes the scale of the causal burden.
To believe political advertising potentially changed that election, one does not need to believe $1.8 million transformed the political beliefs of South Texas.
One needs only to consider whether the entire financial and messaging intervention could plausibly have produced a net effect measured in hundreds of voters out of roughly 45,500.
That is a much less extraordinary proposition.
This is why “Did the candidate win?” is often the wrong dependent variable.
A campaign intervention could move a candidate from an expected 54% to 51% and still appear to have “failed” because the candidate won anyway.
Or it could move a candidate from 49.8% to 50.2% and appear to have “worked” spectacularly despite changing only a tiny fraction of the electorate.
The relevant quantity is performance relative to the counterfactual.
A Better Way to Measure Candidate Performance
Let:
V_i= final candidate vote share
and:
B_i= estimated baseline vote share before the major intervention
Then:
R_i = V_i - B_i
where R_i is residual electoral performance.
If a candidate was polling at an expected 55% before a major advertising wave and ultimately receives 49%, the meaningful phenomenon is not simply “the candidate lost.”
It is:
R_i = -6 percentage points
Estimating B_i is difficult. It can incorporate credible pre-intervention polling, previous election results, incumbency, district partisanship, opponent quality and other structural factors.
This is also where competitiveness becomes critical.
Let p_i represent the target candidate’s expected pre-intervention support as a proportion between zero and one.
Define:
C_i = 4p_i(1-p_i)
At:
p_i = 0.50
we get:
C_i = 1
which represents maximum competitiveness under this simple measure.
As one candidate becomes overwhelmingly favored, Cᵢ declines.
That produces the hypothesis most consistent with the cases examined here:
Electoral Effect of Money ≈ Information Asymmetry × Competitiveness × Candidate Viability
Money should matter most when there is something to amplify.
Money Cannot Easily Manufacture Candidate Viability
Carrick Flynn is one of the clearest cases.
Protect Our Future, the crypto-linked Super PAC associated with Sam Bankman-Fried, had reported approximately $6.99 million in independent expenditures supporting Flynn by April 19, 2022. (Federal Election Commission — Protect Our Future filing)
Flynn finished the Oregon Democratic primary with only 18.6%.
Andrea Salinas won with approximately 36.6%. (Washington Post — Oregon 2022 primary results)
That is an important failure.
Millions of dollars provided Flynn with extraordinary communication resources.
They did not transform him into the electorate’s preferred candidate.
The 2026 Michigan Senate primary supplies an even larger counterexample in the opposite direction.
Outside groups supporting Haley Stevens spent more than $60 million, according to the Associated Press, with more than $30 million attributed to AIPAC and affiliated organizations.
Abdul El-Sayed still won. (Associated Press)
Those cases suggest that money is better understood as an amplifier than as a substitute for underlying political viability.
If a candidate begins far outside the electorate’s acceptable range, enormous spending may still fail.
If two credible candidates begin within several points of each other, changing the perceptions of a comparatively small number of voters may be enough.
The Bowman and Bush Races Show the Other Side
The 2024 Bowman–Latimer contest presents the opposite configuration.
New York’s official results show George Latimer defeating Jamaal Bowman. (New York State Board of Elections)
United Democracy Project’s FEC reports document a multimillion-dollar independent-expenditure campaign, eventually reaching roughly $14.6 million in the primary effort supporting Latimer and opposing Bowman. (Federal Election Commission — United Democracy Project filing)
That is a massive information intervention.
But Latimer was also a highly credible opponent with an existing political base. Bowman had accumulated vulnerabilities independent of outside spending. The race therefore fits the conditional model much better than a mechanical “money bought the election” model.
Missouri in 2024 looks similar.
Official results show Wesley Bell receiving 63,521 votes to Cori Bush’s 56,723, with two other Democratic candidates also receiving votes. (Missouri Secretary of State — August 2024 Primary Results)
UDP reported approximately $8.44 million in election-related independent expenditures by July 30. (Federal Election Commission — United Democracy Project filing)
Again, the intervention was enormous.
Again, Bell was already a credible political figure.
The spending did not need to create an alternative candidate from nothing. It could concentrate on increasing the attractiveness of—or reducing resistance to—an opponent who already had a plausible path to victory.
This appears repeatedly across the stronger examples.
Outside money looks most potentially consequential when it amplifies a candidate who was already capable of winning.
Donna Edwards Shows Why Baseline Conditions Still Matter
In Maryland’s 2022 Democratic primary, United Democracy Project spent approximately $4.26 million opposing former Rep. Donna Edwards and another $1.7 million supporting Glenn Ivey. (FactCheck.org — United Democracy Project)
Ivey won 51.77% to Edwards’ 35.22% in the certified results. (Maryland State Board of Elections)
The size of the intervention is undeniable.
Yet even this apparently straightforward example warns against attributing the entire margin to money.
Contemporaneous polling conducted for Edwards-aligned interests before UDP’s major spending was already showing Ivey ahead in at least one survey. (Jewish Insider — Maryland House race polling)
That does not show the spending had no effect.
It shows why the correct question is:
V_i - B_i
not merely:
V_i
If the underlying race had already moved toward Ivey, an analyst who attributes his entire final margin to outside spending would overstate the evidence.
That distinction is essential if campaign-finance analysis is supposed to measure influence rather than produce a preferred political story.
Outside Money Can Help Progressives Too
The mechanism is not ideologically unique.
In 2020, progressive challenger Marie Newman fought a rematch against incumbent Democratic Rep. Dan Lipinski.
Immediately before the election, roughly $1.6 million in outside spending had entered the contest, and Roll Call reported that all but about $150,000 of it supported Newman or opposed Lipinski. (Roll Call — Newman–Lipinski primary)
Newman won.
Official Illinois results put her at approximately 47.3% to Lipinski’s 44.7%. (Illinois State Board of Elections)
That case matters because it prevents the argument from becoming ideologically self-serving.
If paid political communication can help an establishment-backed candidate defeat a progressive, the same mechanism should be capable of helping a progressive defeat an incumbent when the financial advantage points in the other direction.
The democratic concern is therefore not that one ideology possesses a uniquely manipulative form of money.
It is asymmetrical access to voters’ attention.
Whoever can purchase the larger share of that attention receives an advantage.
The political question is then which coalitions have the resources to create those asymmetries most frequently and at the largest scale.
Why Progressive Candidates and Progressive Policies Can Produce Different Results
Return to Missouri and Nebraska.
A candidate is not a ballot proposition.
“Should employees have paid sick leave?” is an unusually narrow political decision.
A congressional candidate asks voters to evaluate an entire human being and political package.
Foreign policy.
Crime.
Abortion.
Taxes.
Immigration.
Competence.
Character.
Party loyalty.
The president.
Local government.
A scandal from three years ago.
A television advertisement watched the night before voting.
That means candidate preference can move even when the voter’s underlying opinion on a specific economic policy does not.
The policy–candidate gap can be written simply as:
\mathrm{PCG} = P - C
where:
- P = support for the policy
- C = candidate or party vote share being used as a descriptive comparison
For Nebraska:
\mathrm{PCG} = 74.6 - 38.9
\mathrm{PCG} = 35.7 percentage points
Again, that 35.7-point difference is not a count of “hidden progressive voters.”
It measures how badly one could misread the popularity of paid sick leave by looking only at Nebraska’s presidential result.
That is the deeper mistake in treating elections as ideological opinion polls.
The Statistical Model This Question Actually Requires
A rigorous test would combine the variables already developed.
Candidate overperformance or underperformance:
R_i = V_i - B_i
Normalized outside-spending asymmetry:
A_i = \operatorname{sgn}(E_i)\,\ln\!\left(1 + \frac{\lvert E_i\rvert}{N_i}\right)
Candidate-level resource imbalance:
K_i = \ln\!\left(\frac{\text{Opponent campaign spending}+1}{\text{Target campaign spending}+1}\right)
Baseline competitiveness:
C_i = 4p_i(1-p_i)
A fuller model could then be written as:
R_i = \alpha + \beta_1 A_i + \beta_2 K_i + \beta_3 C_i + \beta_4(A_i \times C_i) + \gamma X_i + \varepsilon_i
where X_i contains factors such as incumbency, opponent quality, district changes, endorsements, turnout, major scandals and local political conditions.
The particularly interesting coefficient is:
\beta_4
That term measures the interaction between outside-spending asymmetry and competitiveness.
If the theory developed from these cases is correct, outside financial asymmetry should have a larger effect as an election approaches genuine competitiveness.
In plain English:
Millions of dollars should matter more in a 51–49 race than in an 80–20 race.
This article has not estimated those coefficients across the complete universe of congressional primaries. The equations are a research framework derived from the comparative evidence, not a claim that a causal regression has already established a universal dollar-to-vote effect.
That distinction matters because the evidence is strong enough without inventing precision it cannot provide.
So, Does Big Money Change Election Results?
Yes, it can.
The stronger evidence supports the proposition that political advertising can influence candidate evaluation and voting behavior, while the case studies demonstrate multiple elections in which enormous outside expenditures created radically unequal communication environments. In sufficiently close races, only a very small persuasion effect is mathematically necessary to change the winner. (Political Science Research and Methods)
But the evidence does not support a universal conversion formula in which more dollars automatically produce more votes.
Carrick Flynn lost badly despite nearly $7 million in outside support before his primary.
Summer Lee survived a multimillion-dollar effort against her in 2022.
Abdul El-Sayed won despite more than $60 million in outside spending behind his leading opponent in 2026. (Federal Election Commission — Protect Our Future)
Money is powerful precisely because it does not need to control everyone.
In a close election, changing a small fraction of voters can be sufficient.
The evidence therefore points toward a conditional relationship:
Money’s Electoral Power ≈ Message Asymmetry × Race Competitiveness × Candidate Viability
That model explains far more of the observed evidence than “the biggest spender wins.”
What This Means for the Claim That Americans Reject Progressive Politics
The evidence does not justify saying Americans universally want progressive candidates and are prevented from electing them only by wealthy interests.
Some progressive candidates lose in races without giant outside interventions.
Some survive enormous interventions.
Some progressive policies are popular in places where progressive candidates would struggle badly.
Candidate quality, ideology, local culture, party identity and dozens of other variables remain real.
But the opposite claim is also unsupported.
A progressive candidate’s defeat cannot simply be translated into:
“The voters rejected progressive policies.”
Missouri and Nebraska demonstrate why.
Voters can reject a candidate or political party while approving individual policies associated with the economic left by much larger margins. National polling shows similar cross-partisan support for some labor and tax positions. (Missouri Secretary of State — 2024 General Election Results)
Candidate elections are therefore an imperfect measurement of underlying policy preferences.
And political spending operates directly inside the layer separating those two things.
The Electoral Information Gap
The relationship can finally be expressed as:
\text{Underlying Preferences}
\downarrow
\text{Information Environment}
\downarrow
\text{Candidate Perception}
\downarrow
\text{Vote}
The voter remains the person making the final choice.
Political advertising does not eliminate agency.
But voter agency is exercised using information, perceptions and priorities that campaigns are actively competing to influence.
When one candidate has $2 million worth of opportunities to communicate and the political network opposing that candidate can purchase $15 million worth of communication, those two sides are not competing equally for attention.
That does not invalidate the election.
It does mean the final vote should not be mistaken for an experiment conducted in a neutral informational environment.
This is ultimately the most defensible conclusion from the evidence:
Outside political spending is best understood not as the direct purchase of votes, but as the purchase of disproportionate influence over the information market in which voters make decisions. Its power is conditional rather than absolute, and it appears most capable of changing outcomes when a credible alternative already exists and the underlying election is close.
At the same time, ballot measures demonstrate that Americans can support policies associated with progressives at rates dramatically higher than their support for Democratic candidates.
Those two observations belong together.
They reveal the central weakness in using election results as simple measurements of public ideology.
An election measures a decision made after politics has happened to the voter—after the advertising, endorsements, attacks, news coverage, fundraising, scandals and persuasion.
It does not measure the electorate before those forces arrived.
That distinction is not an argument against democracy.
It is an argument for understanding what democratic elections actually measure.
An election tells us whom voters chose. It does not, by itself, tell us what voters would have chosen under a different information environment.
References and Further Reading
Official Election and Campaign-Finance Records
- Minnesota Secretary of State — U.S. House District 5 Democratic Primary Results — Official election results used to compare Ilhan Omar’s primary performance across election cycles.
- Missouri Secretary of State — 2024 General Election Official Results — Primary source for Proposition A and Missouri presidential election totals.
- Missouri Secretary of State — 2024 Proposition A Official Ballot Information — Describes the minimum-wage and earned-paid-sick-leave provisions presented to Missouri voters.
- Nebraska Secretary of State — 2024 General Election Canvass Book — Official results for Initiative Measure 436 and Nebraska’s presidential election.
- New York State Board of Elections — 2024 Democratic Primary, Congressional District 16 — Official Bowman–Latimer election totals.
- Missouri Secretary of State — August 6, 2024 Primary Election Results — Official totals for the Bush–Bell Democratic primary.
- Federal Election Commission — United Democracy Project Independent-Expenditure Filing — Primary campaign-finance documentation for major UDP independent expenditures.
- Federal Election Commission — Protect Our Future Independent-Expenditure Filing — Documents millions in outside spending supporting Carrick Flynn.
- Illinois State Board of Elections — 2020 Democratic Primary Results — Official results for the Newman–Lipinski rematch.
- Texas Tribune — Henry Cuellar Wins Recount Against Jessica Cisneros by 289 Votes — Documents the extraordinarily narrow final margin in the 2022 South Texas runoff.
- FactCheck.org — United Democracy Project — Detailed review of UDP’s 2022 independent expenditures, including the Cisneros–Cuellar and Edwards–Ivey races.
- Associated Press — How Abdul El-Sayed Went From Political Oblivion to Progressive Breakthrough — Detailed account of the 2026 Michigan Senate primary and the extraordinary outside spending supporting Haley Stevens.
Political-Science Research
- Steven D. Levitt — “Using Repeat Challengers to Estimate the Effect of Campaign Spending on Election Outcomes in the U.S. House” — Foundational research demonstrating why simple correlations between spending and election outcomes can badly misstate causation.
- Political Science Research and Methods — “Estimating the Persuasive Effects of Advertising in Presidential Primary Elections” — Modern research examining the persuasive effects of political advertising while directly addressing strategic ad placement and endogeneity.
Public-Opinion Context
- Pew Research Center — “Most Americans Continue to Favor Raising Taxes on Corporations, Higher-Income Households” — National polling showing majority support for higher taxes on large corporations and high-income households.
- Gallup — Labor Union Approval Remains High — National polling demonstrating broad and partially cross-partisan approval of organized labor.
Editorial note: Campaign-finance totals can vary depending on reporting cutoff, whether an analysis includes 24- and 48-hour independent-expenditure reports, and whether spending supporting one candidate and opposing another is aggregated. Election-law reporting and campaign-finance databases can also be amended after filing. Dollar figures in this article are therefore tied to the cited filing or reporting period rather than presented as timeless totals.