
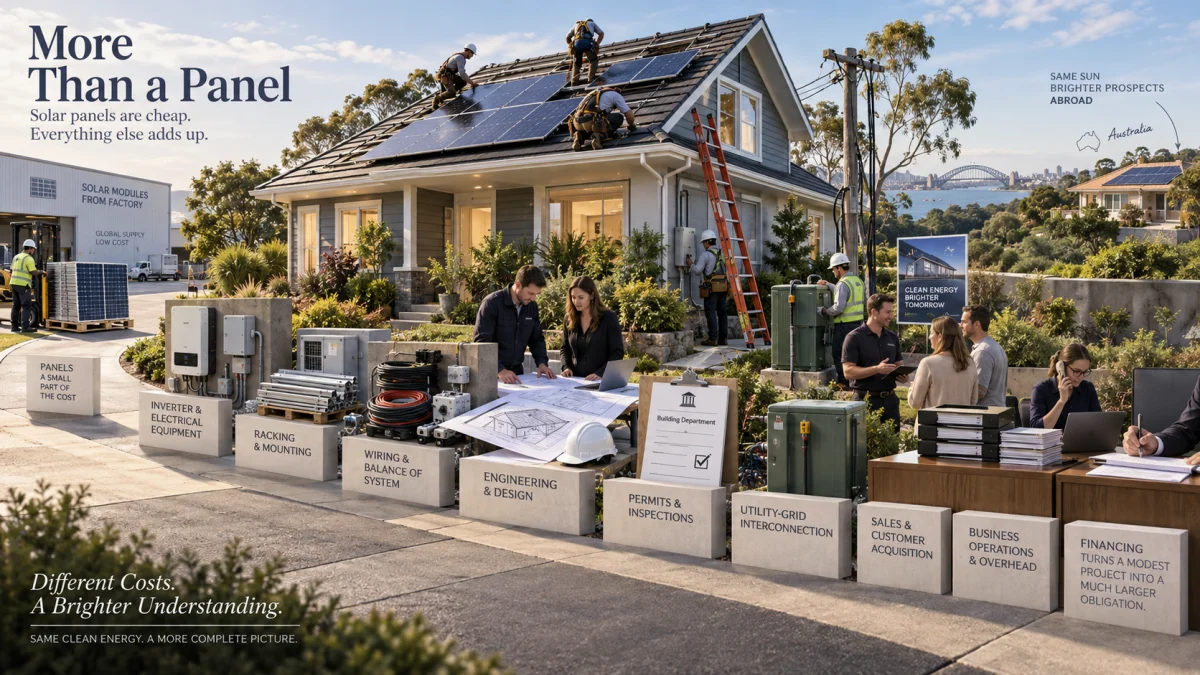
The short answer is that the solar panel is no longer the expensive part of buying rooftop solar.
In late 2025, solar modules in the U.S. market were selling for around $0.27 per watt. Yet the Department of Energy’s latest residential benchmark puts an 8-kilowatt professionally installed rooftop system without a battery at about $2.95 per watt. Berkeley Lab’s enormous database of actual installations independently puts the median 2025 cash-purchased residential system at almost exactly $3.00 per watt. (The Department of Energy’s Energy.gov)
For a hypothetical 8 kW system, those numbers imply something striking:
| What is being priced? | Approximate price |
|---|---|
| 8 kW of modules at $0.27/W | $2,160 |
| DOE modeled 8 kW installed system at $2.95/W | $23,600 |
| Berkeley Lab 2025 median cash installation at $3.00/W | $24,000 |
Those figures are not a formal bill of materials—the module market price and complete-system benchmarks come from different datasets. But they reveal the scale of the paradox.
The panels themselves can represent only around a tenth of the price of a finished American rooftop solar project.
And there is another layer that makes solar pricing even more confusing: the same installation can have one price if you pay cash and a substantially higher price if you finance it.
That means there are really at least four different numbers people casually call “the price of solar”:
- the price of the panels;
- the cash price of the complete installed system;
- the amount financed;
- the total amount ultimately repaid after interest.
Those are very different things.
A $0.27/W panel does not create a $0.27/W solar system
A solar module is a manufactured commodity. A residential solar installation is a small construction, electrical, engineering, permitting, utility and financial project assembled individually on someone’s house.
The Department of Energy separates modern solar-system costs into categories that include modules, inverters, structural equipment, electrical equipment, fieldwork, office work and developer or other costs. DOE’s broader definition of solar “soft costs” includes design, siting, permitting, installation, interconnection, financing, customer acquisition, training, supply-chain management and business overhead. (The Department of Energy’s Energy.gov)
So when the price of a solar panel falls, many of the following costs do not disappear with it.
| Cost layer | What the homeowner is actually paying for |
|---|---|
| Solar modules | The panels that generate DC electricity |
| Inverter or microinverters | Electronics that convert solar output into usable AC electricity |
| Racking and structural equipment | Hardware securing the array to the roof |
| Electrical equipment | Wiring, breakers, disconnects, conduit and other balance-of-system components |
| Design and engineering | System layout, electrical plans and sometimes structural analysis |
| Installation labor | Roof work, electrical work, equipment installation and commissioning |
| Permitting and inspection | Local compliance and safety approval |
| Utility interconnection | Approval to connect the installation to the distribution grid |
| Customer acquisition and sales | Advertising, leads, estimates, sales staff and commissions |
| Administrative work | Scheduling, paperwork, financing coordination and project management |
| Overhead | Vehicles, facilities, insurance, employees, software and other business expenses |
| Warranty and service obligations | Future support and repair exposure |
| Installer/developer profit | Return required for the company to operate |
| Financing | Potential loan fees plus the cost of borrowing |
That is why describing a residential solar quote as “$25,000 worth of solar panels” is fundamentally misleading.
The panels are only one component of the thing being purchased.
Hardware got cheap faster than the rest of rooftop solar
This is the heart of the problem.
Solar manufacturing has become extraordinarily efficient. The Department of Energy reported global module prices at about $0.09/W in the third quarter of 2025. U.S. module prices were substantially higher, at around $0.27/W, in part because American pricing is insulated from global markets by tariffs and other trade restrictions. (The Department of Energy’s Energy.gov)
Yet even the higher U.S. module price is small compared with the roughly $3/W price of an installed residential system.
That means further reductions in factory panel prices have diminishing power over the homeowner’s total bill.
Imagine, as a simple scale comparison, that the entire $0.18/W difference between the reported U.S. and global module prices vanished.
Against a $2.95/W residential system, that $0.18/W represents only about 6% of the installed price.
That does not mean eliminating tariffs would reduce a homeowner’s quote by exactly 6%. Wholesale savings do not necessarily pass through dollar-for-dollar, and these figures come from different market measurements.
It does show something more important:
Even making the physical solar panels dramatically cheaper cannot eliminate most of the cost of an American rooftop installation.
The remaining problem increasingly sits outside the factory.
“Soft costs” are real costs—but the term can be misleading
Solar discussions often divide the price into “hardware” and “soft costs.”
That terminology can make the second category sound unnecessary.
It isn’t.
A licensed electrician doing electrical work is a real cost. Engineering is a real cost. Insurance is a real cost. Installing racking on a steep roof is a real cost. Getting a system safely connected to an electrical grid is a real cost.
At the same time, the broad category of soft costs can also hide enormous differences in efficiency.
If one installer needs more salespeople to acquire each customer, that costs money.
If employees repeatedly prepare different permit packages for different cities, that costs money.
If a project waits while administrative staff coordinate inspections or utility approvals, that costs money.
If sales leads frequently fail to turn into installations, the cost of those unsuccessful leads ultimately has to be recovered from the customers who do buy systems.
If financing introduces another intermediary that needs to earn money, that becomes another layer.
So “soft costs” should not be interpreted as either pure waste or pure necessity.
They are a mixture of necessary work, market structure, administrative friction and business economics.
Permitting matters—but the typical permit is no longer taking months
This is where many explanations of expensive American solar have become outdated.
It is common to hear that rooftop solar is expensive because a homeowner waits months for a city to approve a permit.
Berkeley Lab’s newest data complicate that story.
Its 2026 update contains project-level information on roughly 5.3 million distributed solar and storage systems, including about 450,000 systems installed during 2025. For residential solar-only projects with permitting data, the national median time from permit application to permit issuance was about six days in 2025, down slightly from seven days in 2024. (Energy Analysis Division)
That doesn’t mean permitting is irrelevant.
The range among projects is enormous, and installers operate across thousands of local jurisdictions with differing processes and requirements.
More importantly, the permit itself is only part of the administrative chain.
A typical project may involve:
design → permit application → permit approval → installation → local inspection → utility interconnection approval → permission to operate
The utility process is separate from the municipal permit.
Berkeley Lab’s latest distributed-energy interconnection research contains data from 188 utilities across 24 states, which gives some sense of how decentralized the system is. (Energy Analysis Division)
DOE specifically identifies differing jurisdictions, utilities and state and local rules as contributors to solar’s non-hardware costs. (The Department of Energy’s Energy.gov)
So the better explanation is not:
“Your $25,000 solar system costs that much because City Hall charges a huge permit fee.”
It is:
Thousands of small residential projects must pass through a fragmented collection of design, permitting, inspection and utility processes that are difficult for installers to standardize nationally.
There is still room to automate that system. But blaming the entire U.S. solar price gap on permits would badly overstate the evidence.
The most overlooked solar cost may be customer acquisition
A solar company cannot install a system until it finds someone willing to buy one.
That sounds obvious, but residential solar has an unusual sales problem.
Unlike gasoline, groceries or smartphones, homeowners purchase rooftop solar rarely—usually once, if ever. The installation is expensive, complicated and specific to an individual property.
Companies therefore spend money on advertising, online leads, canvassing, call centers, sales representatives, site visits, proposals and commissions.
DOE explicitly includes customer acquisition among solar soft costs. (The Department of Energy’s Energy.gov)
This also helps explain why two homeowners with similar roofs can receive surprisingly different quotes.
One homeowner may reach a local installer through a referral.
Another may enter through a lead-generation company and then work with a commissioned salesperson.
Another may buy from a large national operation carrying much greater advertising and organizational overhead.
The photons are identical.
The process of acquiring the customer is not.
Then there is financing—and this can change the price dramatically
This is where the meaning of “solar costs $30,000” can start to break down entirely.
Berkeley Lab’s 2026 data show the following median 2025 upfront prices among host-owned residential systems:
| Purchase method | Median reported installed price |
|---|---|
| All host-owned systems | $3.60/W |
| Known cash purchases | $3.00/W |
| Known loan-financed purchases | $4.50/W |
Those prices are before incentives, and the loan-financed figure does not include future interest payments. Berkeley also cautions that financing type could be identified with high confidence for only a subset of host-owned systems.
At first glance, $4.50/W versus $3.00/W looks like financing increased the system price by 50%.
That would be too simplistic.
The two groups are not identical controlled experiments. Different installers, markets, consumers, equipment choices and projects can end up in each category.
Fortunately, Berkeley Lab has separately examined this question using a more sophisticated analysis.
Its 2026 peer-reviewed study estimates that loan-financed residential solar systems carry roughly a 16% to 26% price premium, with loan fees explaining only part of that difference. (Energy Markets & Planning)
Even the lower end of that range is substantial on a purchase costing tens of thousands of dollars.
And this is before considering years of interest.
How a $30,000 solar installation can become a $39,000 loan before interest
The Consumer Financial Protection Bureau documented another feature of some solar-specific financing that homeowners may never encounter when looking at the price of the physical equipment.
Dealer fees.
According to the CFPB, some solar-specific lenders have used fees—variously described as dealer fees, finance fees, program fees, lending fees or similar terms—that increase the financed principal above the cash price.
The bureau reported that these fees commonly ranged from 10% to 30% of the cash price and could exceed 50% in some arrangements. (Consumer Financial Protection Bureau)
The CFPB gave an unusually clear example.
Suppose a solar project has a cash price of:
$30,000
A financing arrangement adds a 30% fee:
+$9,000
The homeowner’s loan principal becomes:
$39,000
And then interest is charged according to the loan terms.
The CFPB’s example says the lender would remit the $30,000 cash price to the installer and retain the $9,000 fee. (Consumer Financial Protection Bureau)
That produces one of the most important lessons for anyone shopping for residential solar:
A low advertised interest rate does not necessarily mean inexpensive financing if the starting loan balance has already been increased.
This does not mean every solar loan contains a 30% dealer fee, nor does it mean all solar financing is deceptive.
It means homeowners should never assume that the financed price and cash price are identical.
There are really four different “prices” of solar
A great deal of confusion disappears once these numbers are separated.
1. The panel price
This is essentially the commodity value of the solar modules.
Current U.S. market pricing has been around $0.27/W. (The Department of Energy’s Energy.gov)
2. The cash installed price
This includes the complete system and everything required to put it on the roof and make it operational.
DOE’s current modeled residential benchmark is $2.95/W for an 8 kW PV-only system, while Berkeley’s 2025 known-cash median is $3.00/W. (The Department of Energy’s Energy.gov)
3. The financed system price
This is the principal that appears on the loan.
Depending on the financing arrangement, it can exceed the cash price before a single dollar of interest accrues.
4. The lifetime financed cost
This is the total amount eventually repaid after interest and other borrowing costs.
It can be substantially higher again.
Comparing a wholesale solar-panel price with the lifetime repayment on a 20- or 25-year solar loan is therefore almost meaningless.
They sit at opposite ends of a very long economic chain.
Why don’t tariffs explain the whole problem?
Tariffs clearly affect U.S. solar economics.
DOE reported that U.S. modules remained near $0.27/W in late 2025 while global prices were around $0.09/W, specifically noting that tariffs and other trade restrictions insulate the U.S. supply chain from global conditions. (The Department of Energy’s Energy.gov)
But tariffs apply primarily to part of the hardware stack.
They do not install the system, design it, sell it, finance it or connect it to the grid.
U.S. solar trade policy is also changing rapidly.
The Section 201 safeguard imposed on crystalline-silicon photovoltaic cells and modules in 2018 and later extended ended on February 6, 2026, according to the U.S. International Trade Commission. Other duties and trade restrictions can still apply. (USITC)
Then, in August 2026, the White House announced a new Section 232 regime for polysilicon and derivative products. Among other provisions, it sets a $0.38/W minimum import price for covered solar modules and additional duties for covered products.
But there is an important date attached:
Those provisions do not take effect until December 4, 2026.
As of September 2026, they should therefore not be treated as an existing cost embedded in today’s installations. (The White House)
Solar trade policy matters.
It simply cannot explain the entire gap between cheap modules and expensive rooftop systems.
What about the federal 30% residential solar tax credit?
For a homeowner buying a new system in 2026, an enormous number of older solar articles are now outdated.
The federal Section 25D Residential Clean Energy Credit is no longer available for expenditures made after December 31, 2025.
The IRS also says homeowners could not preserve the credit merely by paying in 2025 if the original installation was completed after the deadline. For Section 25D purposes, the expenditure is generally treated as occurring when installation is completed. (IRS)
So if you are pricing a normal homeowner-owned installation in 2026, do not automatically subtract 30% from the quote because an older calculator or article tells you to.
State, utility and local programs may still be available.
Commercial projects, third-party ownership arrangements and other tax provisions also operate under different rules.
But the old assumption that a homeowner installing rooftop solar receives a 30% federal Section 25D credit is no longer correct for a new 2026 installation.
Then why is rooftop solar so much cheaper in Australia?
This comparison is useful because Australia demonstrates that cheap solar modules can translate into much cheaper household installations.
But viral comparisons between Australian and American prices often skip several important adjustments.
The biggest is the Australian federal Small-scale Renewable Energy Scheme.
Most qualifying Australian rooftop systems generate Small-scale Technology Certificates, or STCs. The Australian government says installers normally sell those certificates on the customer’s behalf and show their value as a discount directly on the solar quote. (Energy.gov.au)
In other words, an Australian consumer price commonly being shared online can already be a post-subsidy price.
AEMO estimated the average STC rebate across Australia’s main electricity markets at roughly A$346 per kilowatt in 2025, equivalent to about 27% of total PV installation cost in its modeling. (AEMO)
So comparing:
a U.S. pre-incentive price
with
an Australian post-STC consumer quote
overstates the underlying difference immediately.
System size also matters.
Berkeley Lab says the median U.S. residential system installed in 2025 was 7.7 kW. Australia’s Clean Energy Regulator reported that the average residential installation had already reached 9.9 kW in Q1 2025. (LBL ETA Publications)
Larger systems generally have an advantage because certain fixed project costs can be spread over more watts.
Australia also has real installation standards. Systems receiving STCs must use eligible equipment and qualifying installers; cheap Australian solar is not simply the result of eliminating electrical safety rules. (Energy.gov.au)
Does that make the U.S.-Australia price gap disappear?
No.
Even after accounting for subsidies, system size and differences in what the quoted number represents, Australian rooftop solar remains strikingly inexpensive.
That makes Australia an important case study in how a mature, competitive and comparatively standardized residential solar market can push more of the manufacturing cost decline through to homeowners.
What the comparison doesn’t prove is that the entire U.S. price difference represents installer profit.
Different sales models, administrative systems, equipment configurations, labor markets, roofs, grid processes, warranties, business costs and incentives all have to be normalized before making a precise “America costs X times more” claim.
Australia demonstrates that America’s rooftop solar system is expensive.
It does not, by itself, tell us who pockets every dollar of the difference.
Why can two American homeowners get wildly different quotes?
Because there is no national retail price for installing solar on a house.
Consider two systems that both say “8 kW” on the proposal.
One may include basic string-inverter equipment. Another may use microinverters.
One roof may be a simple rectangle. Another may have multiple planes, obstructions or difficult access.
One home’s electrical service may already be adequate. Another may require a panel upgrade.
One homeowner may be paying cash.
Another may be shown a financed contract with substantial embedded financing costs.
One installer may have acquired the homeowner through a referral.
Another may have paid heavily for a lead and commission.
One quote may contain a battery.
Another may not.
One may include roofing or structural work that is barely obvious in the headline number.
That is why comparing only total contract price is a poor way to compare solar proposals.
The most useful standardized number is usually cash price per DC watt, with batteries and major electrical or roofing upgrades separated out.
How to read a solar quote without comparing the wrong numbers
For homeowners, the most useful question may not be:
“How much is solar?”
It is:
“What exactly is included in this particular price?”
Before comparing installers, identify:
- The cash price before incentives. Ask for it even if you expect to finance.
- The DC system size in watts.
- Cash price per watt. Divide the cash system price by its DC wattage.
- The exact panel model.
- The inverter or microinverter model.
- Whether battery storage is included.
- The battery’s separate price, if possible.
- Any electrical-service or main-panel upgrade.
- Any roof work or structural work.
- The financed principal if using a loan.
- The difference between the financed principal and cash price.
- The APR and loan term.
- Total scheduled payments over the life of the loan.
- Which rebates or incentives have actually been included.
A particularly useful calculation is:
Financing markup = financed system price − cash system price
Then:
Financing markup percentage = financing markup ÷ cash price × 100
If a company will quote only a monthly payment but will not clearly provide the cash price, financed principal and loan terms, you do not yet have enough information to understand the transaction.
A simple example shows why this matters
Imagine two companies are offering the same homeowner an 8 kW system.
Installer A
Cash price: $24,000
Cash price per watt:
$24,000 ÷ 8,000 = $3.00/W
Installer B
Financed contract price: $31,200
System size:
8 kW
Financed price per watt:
$31,200 ÷ 8,000 = $3.90/W
Suppose the physical installation is otherwise comparable.
The difference is:
$7,200
or:
30% above the $24,000 cash price
And that $31,200 may still accrue interest.
Without obtaining Installer B’s cash price, the homeowner might instead compare only monthly payments and never realize that the starting principal is much larger.
That is precisely why panel price, installed price and financed price should never be treated as interchangeable.
Cheap panels have exposed a different problem
The remarkable thing about rooftop solar isn’t that panels failed to get cheaper.
They succeeded spectacularly.
Manufacturing became so inexpensive that the solar module itself is no longer the dominant economic challenge in putting solar on an American house.
The remaining price is spread across the rest of the system:
inverter + mounting + electrical equipment + installation + design + permitting + interconnection + sales + administration + overhead + profit + financing
Some of those costs are physically unavoidable.
Some protect safety and reliability.
Some reflect labor and legitimate business expenses.
Some exist because America’s rooftop-solar market is unusually fragmented.
And some financing structures can add thousands of dollars without producing another watt of electricity.
That leads to the simplest answer to the original question:
Solar panels became a cheap mass-manufactured product. Rooftop solar is still a customized construction project wrapped in a sales, regulatory, utility and sometimes expensive financing system.
The cheaper the panel becomes, the harder that distinction is to ignore.
References and Further Reading
U.S. installation costs and market data
U.S. Department of Energy — Solar Photovoltaic System Cost Benchmarks. The primary current federal benchmark used for the $2.95/W modeled market price of an 8 kW residential PV-only system. Solar Photovoltaic System Cost Benchmarks — U.S. Department of Energy
U.S. Department of Energy / National Laboratory of the Rockies — Quarterly Solar Industry Update. Provides late-2025 U.S. and global module-market pricing and broader solar-market context. Quarterly Solar Industry Update — U.S. Department of Energy
Lawrence Berkeley National Laboratory — U.S. Distributed Solar and Storage Data: 2026 Update. Project-level database covering roughly 5.3 million U.S. systems installed through 2025, including pricing, financing, system characteristics and permitting data. U.S. Distributed Solar and Storage Data: 2026 Update — Berkeley Lab
Soft costs, permitting and interconnection
U.S. Department of Energy — Solar Soft Costs Basics. Current DOE explanation of customer acquisition, permitting, financing, installation and other non-hardware solar costs. Solar Soft Costs Basics — U.S. Department of Energy
U.S. Department of Energy — Soft Costs. Broader federal definition of design, siting, permitting, interconnection, financing, customer acquisition, training, supply-chain and operating costs. Solar Soft Costs — U.S. Department of Energy
Lawrence Berkeley National Laboratory — Interconnection Timelines and Costs for Distributed Energy Projects in the United States, 2000–2025. National empirical data covering distributed-energy interconnection at 188 utilities in 24 states. Interconnection Timelines and Costs for Distributed Energy Projects — Berkeley Lab
Solar financing
Consumer Financial Protection Bureau — Issue Spotlight: Solar Financing. Documents solar-specific loan practices, including dealer fees and the CFPB’s $30,000 cash-price/$39,000 loan example. Issue Spotlight: Solar Financing — Consumer Financial Protection Bureau
Lawrence Berkeley National Laboratory — Power Now, Pay Later: The Evolution of U.S. Residential Solar Financing. Peer-reviewed 2026 research estimating roughly a 16%–26% price premium associated with loan-financed systems. Power Now, Pay Later: The Evolution of U.S. Residential Solar Financing — Berkeley Lab
Federal tax and trade policy
Internal Revenue Service — Public Law 119-21 Clean-Energy Credit FAQs. Current IRS guidance explaining termination of the Section 25D Residential Clean Energy Credit after December 31, 2025 and the treatment of installation timing. IRS Clean-Energy Credit Termination FAQs
U.S. International Trade Commission — Evaluation of the Section 201 Solar Safeguard. Confirms that the safeguard covering crystalline-silicon photovoltaic products ended February 6, 2026. USITC Solar Safeguard Evaluation
The White House — Adjusting Imports of Polysilicon and Its Derivatives Into the United States. August 2026 proclamation establishing the forthcoming minimum-import-price and tariff regime effective December 4, 2026. Adjusting Imports of Polysilicon and Its Derivatives Into the United States
Australia comparison
Australian Government — Government Rebates and Loans for Solar. Explains how STCs are generally converted into an upfront discount on Australian household solar quotes. Government Rebates and Loans for Solar — Australian Government
Australian Energy Market Operator — 2025 Distributed PV and Batteries Forecast assumptions. Estimates the 2025 average STC rebate at A$346/kW, roughly 27% of modeled PV installation cost. AEMO Distributed PV and Batteries Forecast Report
Australian Clean Energy Regulator — Small-scale Technology Certificates. Provides Australian rooftop-solar deployment and residential system-size data. Small-scale Technology Certificates — Clean Energy Regulator
Editorial currency note: U.S. solar tax law, tariffs, state incentives, utility compensation rules and financing products can change quickly. Federal tax and trade-policy statements in this article reflect information available in September 2026 and should be reviewed when the article is materially updated.