There is currently no good evidence that Americans need to panic-buy toilet paper or prepare for an imminent nationwide breakdown in trucking. But the energy problem underneath the viral warning is real—and considerably more serious than the toilet-paper claim.
U.S. on-highway diesel averaged $6.285 per gallon nationally on September 14, according to the U.S. Energy Information Administration’s weekly diesel data. California’s statewide average reached $8.039 per gallon. EIA’s California fuel-price series confirms that this is not an isolated $8 gas-station sign circulating on social media. (U.S. Energy Information Administration)
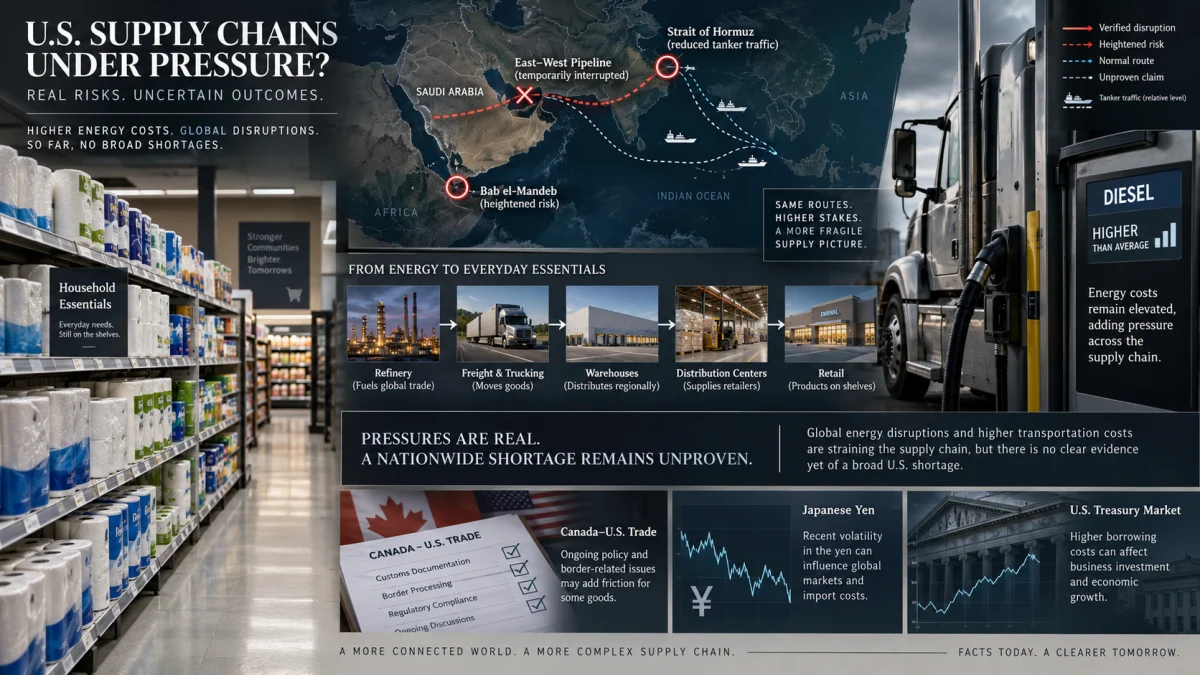
At the same time, shipping through the Strait of Hormuz—the route normally carrying roughly one-fifth of global oil consumption—has fallen to a fraction of normal levels. Saudi Arabia’s 7-million-barrel-per-day East–West Pipeline, one of the major ways Saudi crude can bypass Hormuz, was shut following attacks on September 10. And fighting in Yemen has expanded around the other side of the Arabian Peninsula, near the Bab el-Mandeb chokepoint. (IEA)
Those are substantial developments.
But a real energy shock does not automatically produce empty supermarket shelves.
That distinction is where the viral warning goes wrong.
The most evidence-supported near-term consequence is higher transportation, agricultural and consumer-goods costs, with a growing possibility of selective disruptions if the energy shock persists. A generalized American supply shortage would require several additional things to go wrong.
The Viral Warning Mixes Three Different Stories Together
The circulating argument effectively combines three separate chains of events:
| Claim | What the evidence currently shows |
|---|---|
| Most U.S. toilet paper and paper products come from Canada | Misleading. Canada is the largest foreign supplier of U.S. toilet-paper imports, but U.S. manufacturers supply the overwhelming majority of domestic tissue demand. |
| New Canada tariffs threaten U.S. toilet-paper supplies | Not supported under the current tariff scope. Canadian toilet paper, other tissue products and pulp used by U.S. tissue makers are currently outside the additional duties cited in the warning. |
| Diesel is above $6 nationally | True. EIA’s September 14 U.S. average was $6.285. |
| Diesel is above $8 in California | True. California averaged $8.039. |
| Saudi Arabia’s East–West Pipeline is shut | True. Saudi authorities confirmed the shutdown after September 10 attacks. A partial restoration is now reportedly being pursued. |
| Oil traffic through Hormuz has collapsed | True in substance. The IEA describes flows as having slowed to a trickle. Visible vessel traffic remains extremely low. |
| The Red Sea/Bab el-Mandeb has closed | False as of September 16. The threat has increased sharply, but ships are still transiting the chokepoint. |
| A nationwide U.S. trucker strike is imminent | Unverified. sherafy.com could find no credible national trucking organization, union or major freight publication confirming such an action. |
| Japan’s problems mean it may dump U.S. debt | An unsupported leap. Japan is under genuine energy and currency pressure, but it also has mechanisms specifically designed to obtain dollars without selling Treasuries outright. |
| Nationwide shortages are imminent | Not established. There is evidence of an energy and transportation-cost shock, not yet of a nationwide goods shortage. |
The important question is therefore not whether every element of the warning is false.
Several aren’t.
The question is whether those facts logically produce the conclusion: Americans should begin stockpiling household supplies.
Right now, they do not.
No, Most American Toilet Paper Does Not Come From Canada
Canada really is America’s largest foreign supplier of toilet paper.
According to World Bank WITS trade data based on UN Comtrade, the United States imported about $510 million of toilet paper in 2024, including about $328 million from Canada.
That makes Canada dominant among foreign suppliers.
It does not make Canada the source of most toilet paper Americans use.
The distinction matters enormously.
The American Forest & Paper Association reported on September 15 that U.S. manufacturers supplied 96.3% of U.S. tissue-product demand through July 2026 and said domestic manufacturing capacity is sufficient to meet total domestic demand. AF&PA is an industry association, so its capacity claim should be understood as an interested-party statement rather than independent government analysis. But its current tariff information is consistent with the September changes in federal trade policy. AF&PA’s September 15 tissue-supply update says Canadian toilet paper and other tissue products are not currently subject to the additional 50% tariff, and Canadian pulp used by U.S. tissue manufacturers also remains outside those additional duties. (American Forest and Paper Association)
This exposes a common statistical error in the viral claim:
“Canada supplies most of our imports” is being converted into “most of our supply comes from Canada.”
Those are completely different statements.
The first is supported.
The second is not.
The U.S.-Canada Trade Conflict Is Real—But That Still Does Not Make the Toilet-Paper Claim True
There is a serious trade dispute between the United States and Canada.
The U.S. imposed new tariffs on selected Canadian products in August, and Canada responded with tariffs of 15%, 25% and 50% covering $27.6 billion of U.S. goods beginning September 8, according to the Canadian Department of Finance’s tariff notice. The Trump administration then modified the scope of some of its Canadian tariffs on September 8, with changes taking effect September 15. The White House proclamation modifying the Canadian tariff scope confirms that some products were removed while others remained subject to additional duties. (Canada)
But there are two errors in using that trade conflict as evidence of an imminent toilet-paper shortage.
First, Canada’s retaliatory tariffs apply to American goods entering Canada. They do not themselves impose a U.S. tariff on Canadian toilet paper.
Second, the current U.S. tariff scope cited by the paper industry does not impose the new 50% tariff on Canadian tissue and pulp.
A real trade war can create price distortions without every product traded between the two countries suddenly becoming scarce.
The Diesel Claim Is the Part Americans Should Actually Pay Attention To
The fuel numbers in the viral warning are not exaggerated.
EIA’s September 14 data put the national diesel average at:
$6.285 per gallon.
California:
$8.039 per gallon.
Only five weeks earlier, on August 10, the national figure was $5.257. (U.S. Energy Information Administration)
This matters because diesel is not merely another consumer fuel.
It sits underneath a large share of the physical economy.
Diesel powers long-haul trucks, agricultural machinery, construction equipment and significant portions of industrial and freight activity. Even when a product itself has no relationship to petroleum, the cost of moving that product frequently does.
And the domestic buffer is not especially comfortable.
EIA data released September 16 show U.S. distillate inventories at 107.859 million barrels for the week ending September 11, up from 106.274 million a week earlier. EIA’s weekly distillate inventory series. That weekly increase is good news, but it does not erase the underlying tightness.
Before the latest Saudi pipeline attack even occurred, EIA’s September forecast expected distillate stocks to fall below 100 million barrels in the coming months and remain unusually low. EIA’s September Short-Term Energy Outlook attributes the pressure partly to a tight global distillate market and strong export demand. (U.S. Energy Information Administration)
Meanwhile, U.S. refineries were operating at 96.8% of operable capacity during the week ending September 11. EIA’s refinery-utilization data
That is important for the next step in the logic.
If refinery utilization were 70%, an obvious response to a diesel shortage would be to substantially increase refinery throughput.
At 96.8%, there is much less unused capacity available to absorb another major shock.
Why Producing Huge Amounts of Oil Does Not Protect the U.S. From Expensive Diesel
This is one of the unintuitive parts of the current crisis.
The United States can simultaneously be a major oil producer, a major petroleum exporter and have painfully expensive diesel.
Crude oil is not diesel.
Refining capacity, refinery configuration, crude grade, global refined-product demand, shipping routes and international prices all matter.
In the second quarter of 2026, U.S. distillate exports averaged a record 1.56 million barrels per day, according to an EIA analysis of the Middle East disruption and petroleum markets. That was about 30% above the five-year average. EIA specifically connected the export increase to disruptions around Hormuz tightening the global refined-product market. (U.S. Energy Information Administration)
That does not mean U.S. refiners are irrationally “sending away America’s diesel.”
It means American diesel participates in a global market.
When a major international supply route fails, foreign buyers bid more aggressively for available refined products. U.S. refiners respond to those prices. Domestic prices rise with them.
This is the same underlying reason that being the world’s largest oil producer does not make the United States economically isolated from a global oil shock. See sherafy.com‘s explainer on why the U.S. still imports oil despite producing more oil than any other country.
Hormuz Is the Center of the Energy Problem
The Strait of Hormuz is where the viral warning becomes much more serious.
The International Energy Agency says roughly 15 million barrels per day of crude oil and 5 million barrels per day of petroleum products normally move through Hormuz—together equal to roughly 20% of global oil consumption.
The IEA now describes the current Middle East crisis as producing the largest oil-supply disruption in the history of the global market, with Hormuz flows slowing to a trickle. IEA’s current assessment of the oil shock (IEA)
Even those numbers do not mean precisely zero vessels are getting through.
Shipping tracking has become unusually difficult because vessels can turn off AIS transponders, GPS interference is widespread, and spoofing has been reported. The IEA’s Middle East Maritime Chokepoints Shipping Monitor explicitly warns readers about those limitations. (IEA)
But the observed traffic remains extraordinarily low.
Preliminary tracking reported only four visible Hormuz transits on Tuesday, September 15, compared with a 10-day average of 18. No very large crude carriers or LNG carriers appeared in that day’s visible crossings. The actual number may be somewhat higher because dark vessels will not appear in ordinary AIS counts. (Portnews)
The exact vessel count is therefore uncertain.
The collapse in normal traffic is not.
Then Saudi Arabia Lost One of Its Most Important Ways Around Hormuz
This is the development that makes the current situation more consequential than a normal oil-price spike.
Saudi Arabia’s East–West Pipeline moves crude from the country’s eastern production region toward the Red Sea, allowing oil to avoid Hormuz.
On September 11, the Saudi Ministry of Energy announced that the pipeline had been shut as a precaution after multiple attacks on September 10 in the Riyadh and Madinah regions. The Saudi Press Agency’s official pipeline statement (Saudi Press Agency)
The timing could hardly be worse.
When the primary maritime route is badly disrupted, bypass capacity becomes more valuable.
When the bypass is then disrupted too, the system loses redundancy.
That is the recursive relationship the simple headline “Saudi pipeline shut down” misses.
Normally:
Hormuz disruption → reroute some Saudi crude through the East–West Pipeline.
Now:
Hormuz disruption → greater dependence on the East–West route → East–West Pipeline shutdown → greater dependence on remaining maritime alternatives and inventories.
There is, however, an important September 16 update.
Saudi Arabia is reportedly attempting to bypass the damaged pipeline section and restore approximately half of the line’s capacity within days. Bloomberg reported through Transport Topics that full capacity could return in roughly six weeks, citing a person familiar with the effort. The September 16 pipeline-repair report
That timeline is not yet a guarantee.
But it materially improves the situation if Saudi Aramco can meet it.
Yemen Has Become More Dangerous for Shipping—but the Red Sea Is Not Closed
The viral warning next jumps from Yemen’s escalating conflict to the claim that the Red Sea is likely to be shut down.
The first part deserves attention.
Houthi forces made major territorial gains around the Bab el-Mandeb Strait in September, including reaching Perim, also known as Mayun Island, after Yemeni government forces withdrew, according to Reuters. They also took territory along the adjacent Red Sea coast. Reuters reporting on the Houthi advance to Perim (Investing.com)
That location matters because Bab el-Mandeb is the southern entrance to the Red Sea.
And because Hormuz is already severely disrupted, the importance of an alternative Saudi export route toward the Red Sea has increased.
Again, the risks compound:
Hormuz loses capacity → Saudi Arabia relies more heavily on western export routes → Saudi pipeline is damaged → Bab el-Mandeb simultaneously becomes more militarily contested.
That is a genuine energy-security problem.
But the Red Sea is not currently closed.
Tracking reported 22 vessels transiting Bab el-Mandeb on September 15, compared with 24 a day earlier. (Portnews)
Control of territory near a chokepoint is not the same thing as physically closing it.
There is also an intermediate condition that is easy to overlook: a strait can remain legally and physically open while becoming economically unattractive to many commercial operators because insurance, crew risk or attack probability becomes unacceptable.
That is worth watching.
It has not yet become universal closure.
Is a Nationwide Trucker Strike Really Coming?
As of September 16, sherafy.com could not verify the claim that a nationwide U.S. trucker strike is scheduled because of diesel prices.
That does not mean truckers are doing fine.
Quite the opposite.
When diesel climbs by a dollar per gallon, a long-haul truck burning thousands of gallons per month can see operating costs rise very quickly. Smaller carriers and independent owner-operators generally have less financial room to absorb those increases.
Freight contracts often contain fuel surcharges intended to pass some of those costs to shippers, but recovery is not automatic or perfect. Recent freight-industry analysis has specifically warned that carriers can fail to recover their full fuel costs even where surcharge systems exist. (FreightWaves)
This distinction is important:
A strike means drivers collectively withholding labor.
A capacity contraction can happen without any strike at all.
An owner-operator can simply reject an unprofitable load.
A small fleet can park a truck.
A marginal carrier can fail.
A shipper can discover that the price required to get a load moved has increased sharply.
If enough of that happens simultaneously, available freight capacity declines.
So the absence of evidence for a nationwide strike does not mean high diesel poses no trucking risk.
It means the plausible mechanism is different from the one circulating online.
The Recursive Test: What Actually Has to Happen Before Store Shelves Go Empty?
This is where the shortage claim can be tested rather than merely argued over.
A broad shortage of ordinary consumer goods normally requires some combination of three failures:
Physical supply has to become insufficient.
The transportation system has to become unable or unwilling to move enough of it.
Or consumers have to suddenly buy goods faster than retailers can replenish them.
Now apply that framework to the current situation.
Stage 1: Fuel costs rise
This has already happened.
There is no ambiguity here. Diesel is above $6 nationally and $8 in California.
Stage 2: Transportation costs rise
This is also highly likely and already occurring in parts of freight markets.
Carriers cannot indefinitely absorb a massive increase in one of their largest variable expenses. Fuel surcharges, higher spot rates and contract repricing transfer at least some of that burden to shippers.
Shippers, in turn, generally attempt to pass costs downstream.
That is the pathway from diesel prices to grocery, construction, agricultural and retail prices.
Stage 3: Marginal trucking capacity begins disappearing
This is plausible and there are signs of stress, particularly among smaller operators.
But it does not require a nationwide strike.
If an independent truck costs more to operate than the load pays after fuel and other expenses, the rational business decision is to decline the load or park the truck.
As capacity becomes scarcer, freight prices can rise further.
Eventually, the higher price attracts trucks back into profitable routes or forces shippers to reprioritize loads.
That price mechanism is one reason inflation normally appears before a generalized physical shortage.
Stage 4: Specific goods or regions experience disruption
This becomes increasingly plausible if high diesel persists while other problems occur simultaneously—refinery outages, severe weather, port disruption, another shipping chokepoint closure or a significant contraction in trucking capacity.
Time-sensitive and low-margin goods are particularly vulnerable because transportation cost makes up a larger share of their delivered economics.
A selective shortage is therefore much easier to imagine than every American supermarket suddenly running out of products.
Stage 5: Broad shortages appear
This requires the system to lose enough redundancy that substitution no longer works.
That could happen if multiple major energy routes remained impaired for an extended period while U.S. fuel inventories declined sharply and transportation capacity simultaneously contracted.
We are not there now.
The distinction is crucial.
The current evidence establishes the beginning of the causal chain.
It does not establish the end.
Panic Buying Could Create the Shortage People Are Being Warned About
Toilet paper provides an especially useful example.
There is no strong evidence of a current physical shortage.
But if millions of households are persuaded that a shortage is imminent and each buys several months’ supply at once, retailer inventory can disappear faster than distribution systems are designed to replace it.
A temporary empty shelf then appears.
People photograph the empty shelf.
The photographs become evidence on social media that the original shortage warning was correct.
More people buy.
The prediction begins generating the conditions that make it appear true.
That feedback loop is exactly why “stock up now” claims need a higher evidentiary standard than ordinary economic commentary.
A product can be plentiful at the manufacturing level and temporarily scarce at retail because demand was pulled forward by fear.
That is not the same thing as the country running out.
Japan Is Under Real Pressure. The U.S.-Debt Conclusion Does Not Follow.
The Japan portion of the viral warning contains another mixture of correct facts and an unsupported causal leap.
Japan is exceptionally dependent on the Middle East for crude oil.
Japan’s Agency for Natural Resources and Energy reports that about 95.1% of Japanese crude imports in 2024 came from the Middle East, with the UAE and Saudi Arabia alone providing more than four-fifths. Japan’s official 2024 energy-import data (Enecho)
Japan is also the largest foreign holder of U.S. Treasury securities in the latest available Treasury International Capital country table—not “the largest holder of U.S. debt” overall.
The Treasury table shows Japanese holdings of approximately $1.117 trillion in June 2026. U.S. Treasury data on major foreign Treasury holders
And Japan really has been taking major steps to stabilize the yen.
But it is no longer merely “contemplating” action.
Japan’s Ministry of Finance says it purchased yen in coordination with the U.S. Treasury on July 31 and would not hesitate to conduct further coordinated intervention. Japan’s Ministry of Finance statement on the intervention (Ministry of Finance Japan)
What does not follow is:
Japan needs energy → Japan needs dollars → Japan must dump enormous quantities of U.S. Treasuries → U.S. debt crisis.
There is another mechanism in the chain.
Japan’s Finance Ministry specifically said it plans to use the Federal Reserve’s FIMA Repo Facility. The Federal Reserve describes that facility as a way for approved foreign monetary authorities to temporarily obtain U.S. dollars against their Treasury holdings instead of selling those securities in the open market. Federal Reserve explanation of the FIMA Repo Facility (Federal Reserve)
That does not prove Japan could never sell Treasuries.
It does show why the viral chain from Japanese currency stress to an imminent Treasury dump is incomplete.
The available evidence actually shows U.S. and Japanese authorities coordinating mechanisms designed in part to avoid disorderly market behavior.
So Are U.S. Shortages Coming?
The evidence supports a more precise answer.
A nationwide shortage of ordinary consumer goods is not currently established.
There is no strong case for panic-buying toilet paper. The Canadian tissue argument is largely wrong under the current facts, and the alleged nationwide trucker strike remains unverified.
But dismissing the entire warning would also be a mistake.
The United States is being exposed to an unusually severe global energy disruption.
Hormuz traffic has collapsed.
Saudi Arabia’s major bypass pipeline has been shut.
Yemen’s renewed war has increased risk around Bab el-Mandeb.
U.S. diesel has climbed above $6 nationally.
California diesel is above $8.
Distillate inventories are tight.
U.S. refineries are already operating at high utilization.
Those facts fit together.
The most likely transmission mechanism is not:
Tuesday: expensive diesel. Wednesday: America runs out of toilet paper.
It is:
Energy disruption → higher crude and refined-product prices → higher diesel → higher freight costs → higher production and distribution costs → higher consumer prices → pressure on financially weak carriers → tighter freight capacity → increased risk of selective delays and shortages if the disruption continues.
Every arrow in that chain matters.
Several of the early links are already visible.
The later links remain conditional.
What Would Make the Situation Materially Worse?
The shortage thesis would become substantially more credible if several measurable conditions begin appearing together.
A failure to restore meaningful East–West Pipeline capacity would remove a critical Saudi bypass for longer than markets currently expect.
Persistently near-zero Hormuz traffic would continue restricting one of the world’s largest energy flows.
A sharp collapse in Bab el-Mandeb traffic would weaken another route just as Saudi Arabia needs western export capacity more than usual.
U.S. distillate inventories falling toward or below 100 million barrels while diesel demand remains strong would reduce the domestic buffer further.
Documented widespread parking or failure of trucking capacity would matter far more than social-media rumors about a strike.
And widespread wholesaler or retailer reports of actual inability to replenish essential products—not photographs of isolated empty shelves—would be evidence that the disruption had moved from price inflation toward physical scarcity.
Those are the indicators worth watching.
Should Americans Stock Up?
There is currently no evidence-based reason to hoard toilet paper or clear supermarket shelves.
Ordinary household preparedness is different from panic buying. Maintaining the normal emergency supply of food, water, medications and household necessities that emergency agencies recommend regardless of the news cycle is reasonable.
Buying months of products because a social-media video says trucks are about to stop moving is not supported by the evidence available as of September 16.
The irony is that unnecessary stockpiling could produce exactly the temporary retail shortages the warning predicts.
The Bottom Line
The viral warning gets some remarkably important facts right.
Diesel really has crossed $6 nationally.
California really is above $8.
Hormuz really is severely disrupted.
Saudi Arabia’s East–West Pipeline really was shut after attacks.
Yemen really has become more dangerous around Bab el-Mandeb.
Japan really is heavily dependent on Middle Eastern oil and is the largest foreign holder of U.S. Treasuries.
But those facts are then connected to weaker or unsupported claims.
Most American toilet paper does not come from Canada.
The current Canadian tariff situation does not support an imminent toilet-paper shortage.
The Red Sea is not currently closed.
A nationwide trucker strike could not be independently verified.
Japan’s energy and currency problems do not automatically imply a Treasury selloff.
And none of the available evidence establishes that generalized U.S. consumer shortages are imminent.
The more defensible warning is narrower—and economically significant:
America is already experiencing a major diesel-price shock during an unusually fragile period for global oil transportation. If the disruption lasts long enough, expect higher freight and consumer prices first. If fuel inventories deteriorate, transportation capacity contracts and additional shipping routes fail, selective shortages could follow.
That is serious enough without turning uncertainty into panic.
References and Further Reading
U.S. Fuel, Refining and Inventory Data
EIA — Weekly U.S. Retail Diesel Prices U.S. Energy Information Administration. Primary weekly data establishing the $6.285 national on-highway diesel average for September 14, 2026.
EIA — California Gasoline and Diesel Retail Prices Primary EIA series establishing California’s $8.039 statewide diesel average.
EIA — Weekly U.S. Distillate Fuel Oil Stocks Primary inventory series showing 107.859 million barrels of U.S. distillate stocks for the week ending September 11.
EIA — Refinery Operable Capacity Utilization Primary data showing national refinery utilization of 96.8% during the week ending September 11.
EIA — September 2026 Short-Term Energy Outlook Provides EIA’s latest forecast for unusually low distillate inventories and continued pressure on U.S. diesel prices. Forecasts are projections rather than established future outcomes.
EIA — Petroleum Markets Responded to Middle East Disruptions in the Second Quarter Explains record U.S. distillate exports and how global refined-product shortages transmit Middle East disruptions into U.S. fuel markets.
Canada, Toilet Paper and Trade
American Forest & Paper Association — U.S. Tissue Supply Remains Strong Amid Recent Tariff Updates Industry update stating that Canadian tissue and pulp remain outside the current additional tariffs and reporting that U.S. manufacturers supplied 96.3% of domestic tissue demand through July 2026. AF&PA represents the industry and should be read accordingly.
World Bank WITS / UN Comtrade — U.S. Toilet Paper Imports by Country, 2024 Trade dataset showing Canada as the largest foreign supplier of toilet paper to the United States while allowing the distinction between import share and total U.S. consumption.
Department of Finance Canada — Counter-Tariffs Effective September 8, 2026 Official Canadian documentation of retaliatory tariffs on $27.6 billion of U.S.-origin goods.
White House — September 8 Modification of Canadian Tariff Scope Primary U.S. presidential action documenting changes to products covered by additional Canadian duties.
Hormuz, Saudi Arabia and the Red Sea
International Energy Agency — Sheltering From Oil Shocks IEA assessment describing the current crisis as the largest oil-market supply disruption on record and documenting the severe decline in Hormuz flows.
IEA — Middle East Maritime Chokepoints Shipping Monitor Continuously updated shipping monitor covering Hormuz, Bab el-Mandeb and other regional chokepoints, including important cautions about AIS gaps, spoofing and vessels operating dark.
Saudi Press Agency — East–West Pipeline Shut Down Following Multiple Attacks Official Saudi Ministry of Energy statement confirming the September 10 attacks and precautionary pipeline shutdown.
Bloomberg via Transport Topics — Saudi Arabia Seeks Partial Pipeline Restoration Within Days September 16 reporting on efforts to bypass a damaged section and restore roughly half of the line’s capacity. The timetable is based on reporting rather than an official guarantee.
Reuters — Houthis Reach Perim Island at Bab el-Mandeb Reporting based on Yemeni government sources documenting the September advance around one of the world’s major maritime chokepoints.
September 16 Shipping Data — Hormuz and Bab el-Mandeb Traffic Reuters-derived vessel-tracking figures showing extremely limited visible Hormuz traffic while confirming that Bab el-Mandeb remains in use.
Japan, Currency Intervention and U.S. Treasuries
Japan Agency for Natural Resources and Energy — Japan’s 2024 Energy Import Sources Official Japanese data showing approximately 95.1% Middle East dependence for crude-oil imports.
U.S. Treasury — Major Foreign Holders of Treasury Securities Treasury International Capital data showing Japan as the largest foreign holder in the latest country table available when this article was prepared.
Japan Ministry of Finance — August 3 Statement on Coordinated Yen Intervention Primary statement confirming July 31 yen purchases coordinated with the U.S. Treasury and Japan’s intention to consider additional intervention.
Federal Reserve — FIMA Repo Facility FAQs Explains how approved foreign monetary authorities can temporarily obtain dollar liquidity against Treasury securities as an alternative to open-market sales.
Editorial Currency Note
Fuel prices, oil inventories, shipping traffic, military control near maritime chokepoints, tariff coverage and pipeline repair status are changing rapidly. This article reflects information verified through September 16, 2026. Forecasts and reported repair timelines should not be treated as guaranteed future outcomes.