Article type: Structured evidence review
Scope: Prenatal and early-childhood traffic-pollution research; international evidence with U.S. definitions and resources
Last updated: August 1, 2026
Evidence confidence: Low for causation; moderate for an association signal
Commercial disclosure: No relevant commercial relationship disclosed
The short answer
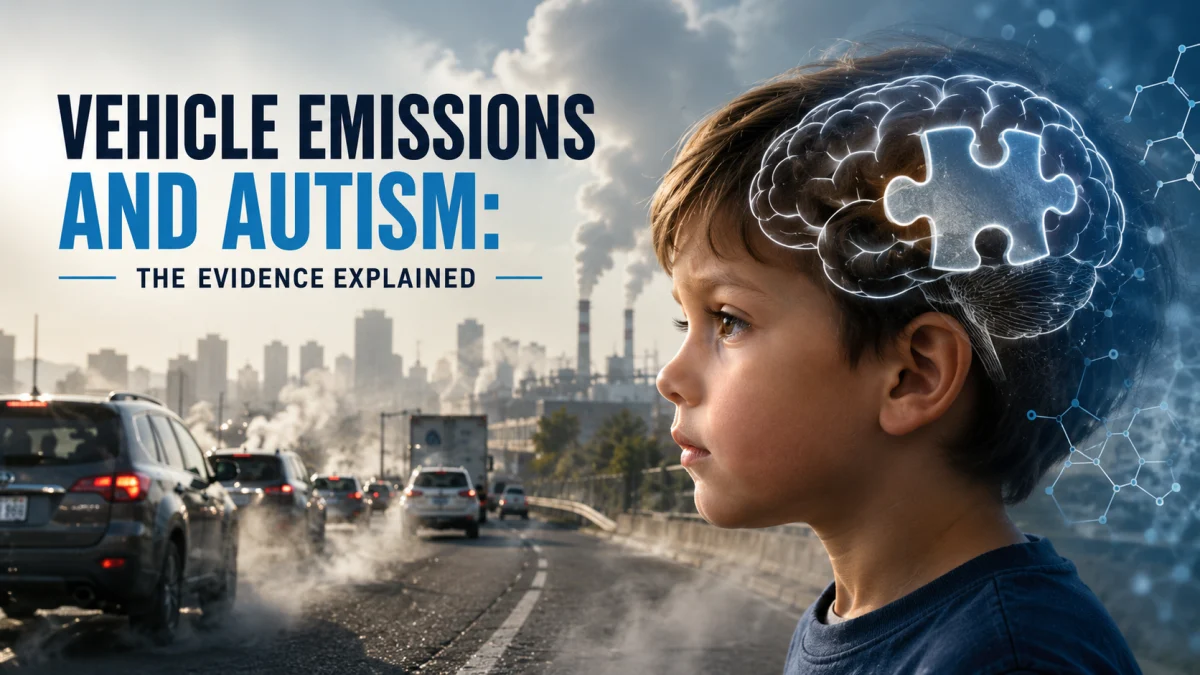
Multiple observational studies report that children with higher modeled exposure to certain traffic-related air pollutants during pregnancy or early life have modestly higher odds of an autism diagnosis. The pattern is not consistent enough to say that vehicle emissions cause autism.
The strongest signals involve fine particulate matter (PM2.5), nitrogen oxides, black carbon, some traffic-related air toxics, and—in newer work—particles from brake and tire wear. But studies disagree about which pollutant matters, when exposure matters, and how large the association is. Nearly all estimate outdoor pollution at a home address rather than measuring what a pregnant person or child actually breathed.
This evidence supports cleaner air as a public-health goal. It cannot identify why one person is autistic, establish an autism-specific “safe” exposure level, or promise that moving, buying an air cleaner, or changing vehicles will prevent autism.
Autism is a developmental disability with multiple contributing pathways. The CDC says scientists believe multiple causes can act together, while many causes remain unknown. An association with pollution is one research question within that larger picture—not a reason to blame a parent, a pregnancy, a neighborhood, or an autistic person.
“Emission rate” is not the same as exposure
A vehicle emission rate may be reported as grams of a pollutant per mile, per vehicle, per start, or per hour of idling. EPA’s MOVES model combines rates with driving activity and other conditions to estimate emissions. Autism studies usually begin much farther down the chain.
| Measure | What it tells us |
|---|---|
| Vehicle emission rate | Pollutant mass per mile, vehicle, start, or operating time under specified conditions |
| Emissions inventory | Estimated mass released by sources in an area and time period |
| Ambient concentration | Pollutant measured or modeled in outdoor air, often in micrograms per cubic meter or parts per billion |
| Personal exposure | What a person actually encounters after location, time, indoor air, ventilation, weather, and behavior are considered |
Most autism studies assign an ambient concentration to the mother’s residential address during pregnancy. Some add address histories, roadway models, satellite data, air monitors, or source-oriented chemical models. These are useful population tools, but none converts a car’s grams-per-mile rating into an individual child’s autism probability.
Traffic pollution is also a mixture. It includes tailpipe exhaust; fuel evaporation; nitrogen oxides; carbon monoxide; volatile organic compounds such as benzene; black and elemental carbon; brake and tire particles; and resuspended road dust. NO2 can also help form ozone and secondary fine particles. Weather, road design, vehicle mix, congestion, and distance from traffic change the concentration people encounter.
That is why a statement such as “this vehicle emits X grams per mile” cannot be followed by “therefore autism likelihood changes by Y.” No validated conversion exists.
What the combined evidence shows
A 2024 systematic review restricted its main analysis to cohort studies. It included 27 studies, with 22 in meta-analysis and about 1.29 million participants across many environmental pollutants. For nitrogen dioxide, the pooled relative risk was 1.20, but results varied enormously between studies (I² = 91%). A broader nitrogen-oxides grouping produced a smaller pooled estimate of 1.09 with less heterogeneity (I² = 34%).
The review’s own certainty assessment was low or very low across its analyses because of heterogeneity and possible publication bias. Its search ended in January 2023, so it does not include several large newer studies.
That combination—repeated positive associations, high disagreement, and entirely observational evidence—is the core of the field.
What the most informative recent studies add
The numbers below are relative estimates for the exposure contrast defined by each study. They should not be compared as if every row tested the same dose.
| Study | Main finding | Why it matters |
|---|---|---|
| California, 13.6 million births | PM2.5 OR 1.10 and NO2 OR 1.25 per study-specific IQR; benzene and nickel estimates were larger | Enormous sample and direct traffic-toxics models, but exposure and diagnosis were administrative/model-based and follow-up differed by birth era |
| Southern California, 318,750 births | On-road gasoline PM2.5 HR 1.18 per SD in a single-source model and 1.12 after multi-source adjustment | Supports source-specific study; on-road diesel was not positively associated after adjustment |
| ASD-discordant siblings, 4,024 children | Non-tailpipe copper, iron, and manganese tracers had ORs 1.17–1.29; tailpipe elemental and organic carbon estimates included no association | Controls many shared family factors, while remaining smaller and vulnerable to pregnancy-specific differences |
| Denmark, 850,361 births | Per-IQR ORs were 1.04 for PM2.5, 1.05 for black carbon, and 1.15 for NO2 | Positive findings at comparatively low ambient levels; pollutants were correlated and exposure came from the address at delivery |
| Metro Vancouver, 132,256 births | NO OR 1.07; PM2.5 and NO2 estimates included no association | Large, standardized autism ascertainment and a clear mixed result |
| U.S. ECHO, 8,035 pairs | Ozone was associated with higher trait scores and ASD; PM2.5 and NO2 results varied substantially by region | Very recent, geographically diverse evidence that also shows how unstable pollutant-specific results can be |
The giant California cohort
A 2025 California study linked 13,591,003 births from 1990–2018 with 138,460 autism records. It modeled PM2.5, NO2, ozone, and six traffic-related air toxics at residential locations. Per interquartile-range increase, reported odds ratios were 1.10 for PM2.5 and 1.25 for NO2. Benzene was 1.55 and nickel 1.32.
The authors found that PM2.5 weakened after adjustment for NO2, while the NO2 estimate remained. They also reported smaller effect estimates in later birth periods.
This is important evidence, but size does not remove systematic error. The autism records came from California’s Department of Developmental Services, which does not capture every autistic child equally. Exposure was modeled rather than personally measured. Children born late in the study had much less time to receive a recorded diagnosis than children born earlier. Changes in pollution, diagnostic practice, services, residential patterns, and data quality occurred together over almost three decades.
The study can show a large population pattern. It cannot prove that a specific pollutant caused autism or that reduced pollution explains the change in its estimates over time.
Tailpipe and non-tailpipe particles do not tell a simple story
A 2024 Southern California cohort used a chemical-transport model to separate PM2.5 from nine sources. On-road gasoline particles had the strongest traffic-related positive association: a hazard ratio of 1.18 per standard-deviation increase in the single-source model and 1.12 after adjustment for multiple sources. On-road diesel was null in the single-source analysis and inverse after multi-source adjustment—an unexpected result the authors said might reflect collinearity.
A 2025 analysis compared siblings born to the same mother when one had an autism diagnosis and another did not. Prenatal exposure estimates for copper, iron, and manganese—tracers associated with brake, tire, and roadway wear—had odds ratios from 1.17 to 1.29 per interquartile increase. Elemental and organic carbon, treated as tailpipe tracers, had estimates of 1.10, but both confidence intervals crossed 1.0.
Sibling comparisons reduce confounding from stable family genetics and many shared social conditions. They do not control everything that changes between pregnancies: address, traffic, maternal health, age, work, infection, stress, medication, income, or diagnostic opportunity. The study also included only families with siblings who differed in autism diagnosis, so it does not represent every family.
Together, these studies make non-tailpipe pollution harder to ignore. They do not establish that brake dust, tire wear, gasoline exhaust, or any single metal is an autism cause.
Large studies still disagree
The 2026 Danish nationwide cohort reported positive associations for PM2.5, black carbon, and NO2. Its per-interquartile estimates ranged from 1.04 to 1.15.
By contrast, a 2019 Metro Vancouver cohort found an association with nitric oxide but not with PM2.5 or NO2. Four European population cohorts in the ESCAPE project found no association between pregnancy NO2 and autistic traits in the borderline or clinical range. A 2026 U.S. ECHO analysis found that PM2.5 and NO2 associations varied greatly by census division, while ozone showed the clearest overall signal.
These are not merely “positive versus negative” votes. Different places have different pollutant mixtures, exposure ranges, vehicle fleets, weather, housing, diagnosis systems, and correlations between pollutants. Researchers also choose different time windows and statistical models. A result may change when a second pollutant or postnatal exposure is added.
How large are the reported associations?
An odds ratio of 1.10 means 10% higher odds for the study’s specified exposure contrast. It does not mean a 10-percentage-point increase in autism probability.
For scale only, suppose a comparable population had a 1% baseline probability. If an odds ratio of 1.10 were causal and transportable to that population, the corresponding probability would be about 1.10%—roughly one additional case per 1,000 people, not 100 additional cases per 1,000. An odds ratio of 1.25 would correspond to about 1.25%, or about 2.5 additional cases per 1,000.
Those are mathematical illustrations, not predictions. Baseline autism identification differs by place, birth year, age, sex, service access, and diagnostic practice. Each study’s interquartile range also represents a different pollution contrast.
Large populations can detect small associations precisely. Precision does not guarantee that the association is causal, clinically meaningful for one family, or free of bias.
Why causation remains unsettled
Exposure is estimated, not inhaled dose
Residential models cannot fully capture work, commuting, time indoors, ventilation, filtration, street orientation, daily movement, or relocation. A home-address estimate may be a reasonable ranking tool while still misclassifying individual exposure.
Pollutants travel together
NO2, black carbon, ultrafine particles, noise, heat, road density, and socioeconomic conditions can be correlated. A model that attributes an association to one pollutant may be capturing a mixture or another feature of living near traffic.
Neighborhood and family factors are difficult to remove
Housing cost, health-care access, parental age and education, occupational exposure, maternal health, race and racism, and local diagnostic services can relate to both pollution and autism identification. Statistical adjustment, negative controls, and sibling comparisons help, but none guarantees that residual confounding is gone.
Autism ascertainment changes the outcome
Some studies use standardized assessments. Others use insurance records, health-system diagnoses, service registries, parent reports, or trait scales. These outcomes overlap, but they are not identical. Access to diagnosis can create geographic and socioeconomic patterns that resemble exposure effects.
Researchers test many windows and pollutants
Pregnancy averages, trimesters, individual weeks, preconception, and the first year of life may all be analyzed across several pollutants and subgroups. Without careful correction and replication, the most striking result can be a chance finding or a model-dependent estimate.
Publication and model-selection bias remain possible
Positive findings are more likely to attract attention and may be easier to publish. The 2024 cohort-only review explicitly rated its evidence low or very low in part because of possible publication bias. New large studies improve the evidence base, but they do not turn it into a randomized experiment.
Plausible biology is not proof
Researchers have proposed several mechanisms: maternal or placental inflammation, oxidative stress, altered immune signaling, vascular effects, mitochondrial stress, and changes in gene regulation during brain development. Traffic particles and gases can plausibly influence biological systems, and air pollution has established respiratory and cardiovascular harms.
But a plausible pathway answers “could this affect development?” It does not answer “did it cause this child’s autism?” A mechanism observed in cells, animals, blood markers, or placental tissue cannot by itself establish the population effect, its size, or which component of a complex mixture matters.
What this means for parents and autistic people
Do not use this evidence to assign blame
The studies cannot reconstruct the cause of one person’s autism. They do not show that a parent failed to avoid traffic, chose the wrong home, drove the wrong vehicle, or could have prevented a developmental outcome. Many people cannot choose where they live or work, and pollution burdens are shaped by housing and transportation policy.
There is no clinical test for “pollution-caused autism”
An air-quality map, blood test, hair test, metal panel, or commercial “toxin” screen cannot determine that traffic exposure caused autism. Be wary of anyone who uses this literature to sell detoxification, chelation, supplements, or an autism “reversal” program.
Reducing pollution after diagnosis is not an autism treatment
Cleaner air can benefit respiratory and cardiovascular health. It does not erase autism or replace communication support, education, accommodations, medical care, or services chosen by an autistic person or family.
Do not delay evaluation
If a child has developmental differences or a loss of skills, seek an appropriate evaluation and needed support. Trying to identify a past environmental cause should not postpone current care.
Reasonable actions without an autism promise
These steps are supported by general air-quality and pregnancy-health guidance, not by proof that they prevent autism:
- Use EPA’s AirNow forecast and current Air Quality Index to plan strenuous outdoor activity when pollution is high.
- Avoid unnecessary vehicle idling near homes, schools, and child-care pickup areas. EPA provides school anti-idling materials.
- If pregnancy involves unusually high occupational or neighborhood exposure, discuss the actual source and circumstances with an obstetric clinician or an environmental-health specialist. ACOG recommends including environmental exposure in prepregnancy and prenatal histories.
- Support community measures that reduce exposure at the source: cleaner fleets, effective emissions rules, safer school siting, anti-idling programs, and better building filtration where traffic exposure is high.
- Treat expensive personal interventions cautiously. An air cleaner may reduce some indoor particles when correctly selected and used, but it cannot remove every traffic pollutant and should not be marketed as autism prevention.
The most defensible conclusion is population-level: reducing air pollution has established health benefits and may also reduce a possible neurodevelopmental risk. The autism-specific size of that benefit is not yet known.
What evidence would change the conclusion?
Confidence would rise with:
- repeated findings from large prospective cohorts using personal or time-activity-informed exposure measures;
- consistent effects for the same pollutant, dose scale, and developmental window;
- natural experiments showing that a pollution reduction is followed by a predicted change in autism diagnoses without parallel changes in ascertainment;
- sibling, negative-control, and other causal-inference designs that converge;
- better separation of traffic pollution from noise, neighborhood conditions, and health-care access;
- preregistered analyses with replication in different populations; and
- biological markers that connect measured exposure to a coherent human developmental pathway without being used as a diagnostic shortcut.
Confidence would fall if better-controlled studies repeatedly found null results, if associations disappeared with improved exposure measurement or diagnosis ascertainment, or if corrections or retractions undermined load-bearing studies.
How this review was conducted
This is a rapid, structured evidence review current through August 1, 2026, not a formal systematic review or GRADE assessment. Searches covered PubMed, PubMed Central, journal sites, CDC, EPA, NIEHS, AirNow, ACOG, the live Sherafy site, and local Sherafy article bundles.
Priority went to a cohort-only meta-analysis, large population cohorts, source-specific studies, a sibling comparison, a negative-control analysis, contradictory cohorts, and current official definitions and guidance. The review checked study design, population, exposure method, autism ascertainment, effect size, precision, confounding controls, pollutant correlation, funding or conflicts, and correction or retraction status.
Important limits remain: this was an English-language rapid review; it did not reproduce every model or pool a new effect estimate; and several 2025–2026 studies are too new to have substantial independent replication.
References and further reading
Evidence syntheses
- Duque-Cartagena T, Dalla MDB, Mundstock E, et al. Environmental pollutants as risk factors for autism spectrum disorders: a systematic review and meta-analysis of cohort studies. BMC Public Health. 2024;24:2388.
Recent and high-value primary studies
- O’Sharkey K, Mitra S, Chow T, et al. Prenatal exposure to criteria air pollution and traffic-related air toxics and risk of autism spectrum disorder: A population-based cohort study of California births (1990–2018). Environment International. 2025;201:109562.
- Luglio DG, Kleeman MJ, Yu X, et al. Prenatal exposure to source-specific fine particulate matter and autism spectrum disorder. Environmental Science & Technology. 2024;58:18566–18577.
- Rahman MM, Carter SA, Lin JC, et al. Discordant sibling analysis of autism risk associated with prenatal exposure to tailpipe and non-tailpipe particulate matter pollution. Environmental Research. 2025.
- Lim YH, Lawlor C, Bergmann M, et al. Prenatal exposure to air pollution and the development of autism spectrum disorder from birth to adolescence: A nationwide Danish cohort study. Environmental Epidemiology. 2026.
- Ghassabian A, Dickerson AS, Wang Y, et al. Prenatal air pollution exposure and autism spectrum disorder in the ECHO Consortium. Environmental Health Perspectives. 2026;134:324–334.
- Pagalan L, Bickford C, Weikum W, et al. Association of prenatal exposure to air pollution with autism spectrum disorder. JAMA Pediatrics. 2019;173:86–92.
- Guxens M, Ghassabian A, Gong T, et al. Air pollution exposure during pregnancy and childhood autistic traits in four European population-based cohort studies: The ESCAPE Project. Environmental Health Perspectives. 2016;124:133–140.
- Raz R, Levine H, Pinto O, et al. Air pollution and autism spectrum disorder in Israel: A negative control analysis. Epidemiology. 2021.
- Volk HE, Lurmann F, Penfold B, Hertz-Picciotto I, McConnell R. Traffic-related air pollution, particulate matter, and autism. JAMA Psychiatry. 2013;70:71–77.
Definitions and practical guidance
- CDC. About Autism Spectrum Disorder. Updated April 13, 2026.
- National Institute of Environmental Health Sciences. Autism. Current through 2026.
- U.S. Environmental Protection Agency. Research on Near Roadway and Other Near Source Air Pollution. Updated June 2, 2026.
- U.S. Environmental Protection Agency. Basic Information about NO2.
- AirNow. Using the Air Quality Index.
- American College of Obstetricians and Gynecologists. Reducing Prenatal Exposure to Toxic Environmental Agents. Committee Opinion No. 832.