The claim that “Gazans voted Hamas into power” is technically true—but only for a small slice of the people now living in the strip. Nearly two decades have passed since the last Palestinian legislative election. Gaza’s population has doubled, birth-rates have remained among the world’s highest, and time itself has quietly rewritten the electoral map.
Who could vote in 2006?
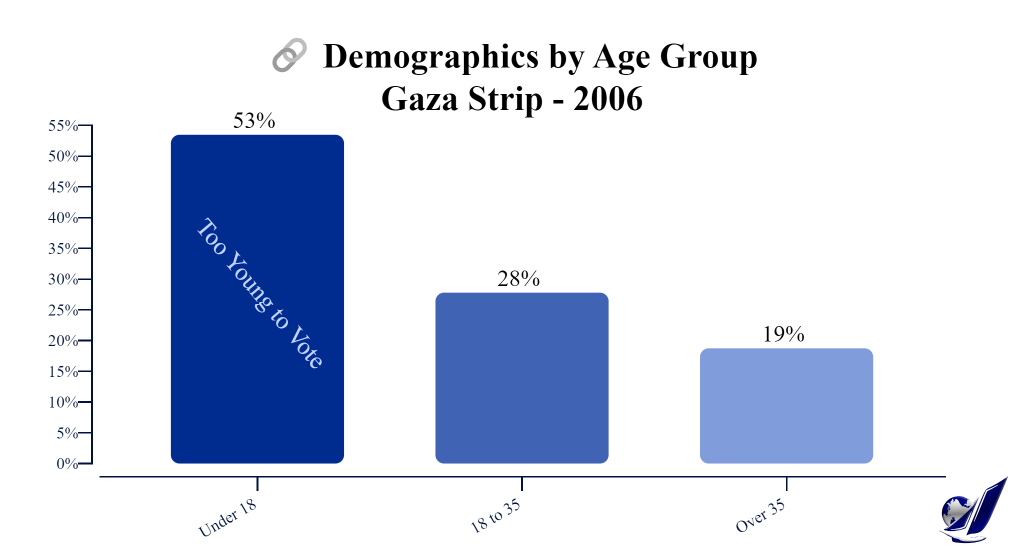
When Palestinians went to the polls on 25 January 2006, Gaza held about 1.34 million people. Just under half (46.5 %) were old enough to cast a ballot. Turn-out was unusually high—about 77 percent—after a decade-long wait for a new legislature. Hamas’ Change-and-Reform list captured 44–45 percent of the popular vote, enough for a clear parliamentary majority.
Fast-forward to 2025
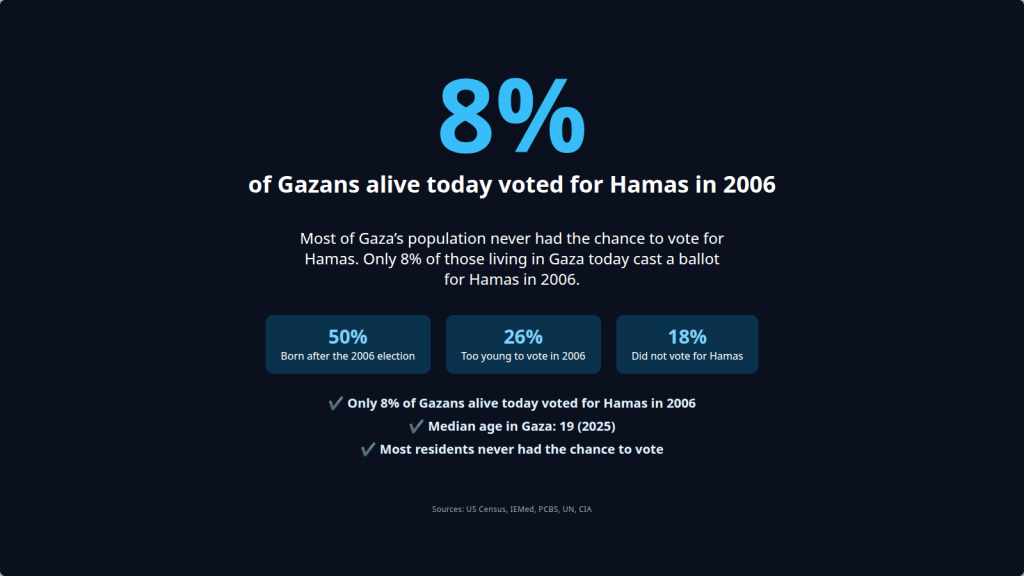
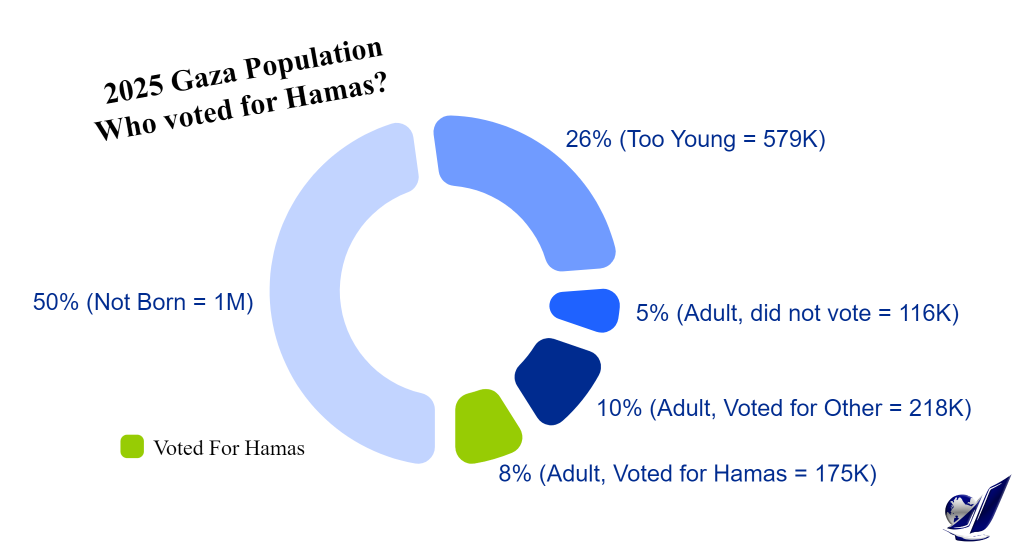
Gaza’s population now tops 2.18 million. Demographically it is one of the youngest societies on earth: half the residents are children who were not even born when the election was held; another quarter were toddlers or school-age kids. Only one person in four living in Gaza today was old enough to vote in 2006, and even within that group not everyone actually voted.
Crunching the numbers
Combine the share of today’s residents who were voting-age in 2006 (23 %) with the official turnout rate (≈ 77 %) and you find that about 18 percent of the current population actually cast a ballot. Apply Hamas’ 44 percent vote share to that subset and the headline figure collapses: roughly eight percent of present-day Gazans voted for Hamas in 2006.
Why it matters
Talking points that frame Gaza as collectively responsible for Hamas overlook three structural facts:
- Demographic turnover – Three quarters of the population literally could not have participated.
- Single-election freeze – No legislative vote has taken place since 2006; political preferences have never been re-tested at the ballot box.
- Geography vs. national tallies – Hamas’ share was calculated across both West Bank and Gaza districts; its Gaza-only vote was higher, but still represents a clear minority of today’s residents.
Beyond the math.
Blaming all Gazans for Hamas’ rule obscures legitimate grievances about war, governance, blockade, and occupation—and it sidelines younger generations who never had a voice in the first place.
Recognizing that only a small fraction of today’s population endorsed Hamas at the ballot box encourages more nuanced conversations about accountability, humanitarian law, and the prospects for any future political settlement.
Closing Thought
Statistics may not always settle moral arguments, but they can prevent us from aiming collective punishment at people who never had a chance to choose their leaders.
Sources
Population Data, 2006 and 2025 – US Census Bureau
Election Data, 2006 – IEMed
Further Reading
- Canadians for Justice and Peace in the Middle East. (n.d.). Fact Sheet No. 12: Gaza’s Population and Demographics.
- Palestinian Central Bureau of Statistics. (2007, February 1). Press Release: Estimated Population in the Palestinian Territory, by Governorate, End Year 2006.
- Editorial Board. (2023, October 30). Hamas came to power in flawed elections. But its popularity has never been tested since. The Washington Post.
- ReliefWeb. (2006, July 6). oPt: Gaza Fact Sheet #6.
- United Nations. (2006, January 29). Palestinian Legislative Council elections, 25 January 2006 – Statement by UN Secretary-General.
- The Carter Center & National Democratic Institute. (2006, April). Final Report: Observing the 2006 Palestinian Legislative Council Elections.
- International Foundation for Electoral Systems. (n.d.). Election Guide: Palestine Legislative Council, January 25, 2006.
- WAFA – Palestine News & Information Agency. (n.d.). Palestine Legislative Elections.
- United States Institute of Peace. (n.d.). Palestinian Politics Timeline: 2006 Election.
- Central Intelligence Agency. (n.d.). The World Factbook: Gaza Strip.