A deep dive into one of food’s most polarizing controversies—and why the truth might surprise you.
The Great Sugar Showdown
Why the Cane Sugar vs. High-Fructose Corn Syrup Debate Is Both Everything and Nothing You Think It Is.
Picture this: You’re at a taco truck with friends on a sweltering summer day. Someone pulls out a glass-bottled Mexican Coca-Cola, condensation beading on its iconic curves. “This is the real stuff,” they declare with the conviction of a sommelier discussing a vintage Bordeaux. “Made with actual cane sugar, not that corn syrup garbage.”
The others nod knowingly. Someone mentions they only buy “natural” sodas sweetened with cane sugar. Another friend chimes in about how Europe doesn’t allow high-fructose corn syrup. The conversation spirals into familiar territory—processed foods, chemical additives, and the general sense that somehow, somewhere, the food industry is pulling one over on us.
Sound familiar? You’ve just witnessed one of modern food culture’s most persistent debates in its natural habitat. It’s a controversy that spans grocery store aisles, dinner tables, and social media comment sections. But here’s the twist: what if both sides are missing the real story?
Today, we’re going to unravel this sticky situation with science, not sentiment. We’ll explore why your body doesn’t care nearly as much about this distinction as your taste buds might, why that Mexican Coke might actually taste different (but not for the reasons you think), and why the real villain in this story isn’t what you’d expect.
Buckle up. This journey through the molecular world of sweetness is about to challenge everything you thought you knew about sugar.
The Chemistry Behind the Controversy
Understanding What We’re Actually Comparing
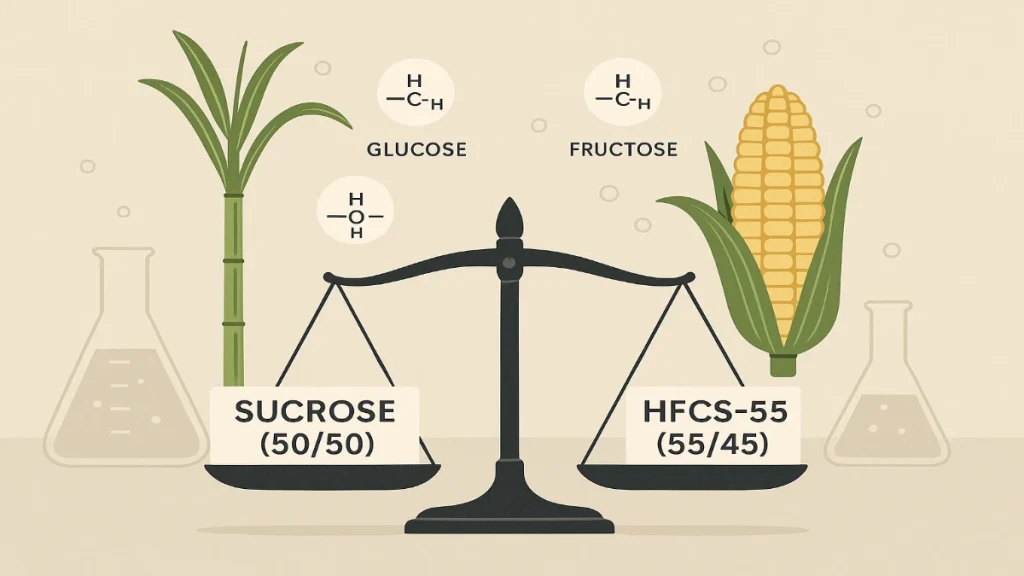
Before we can settle any debate, we need to understand our contestants. In the left corner, wearing the “all-natural” championship belt, we have cane sugar. In the right corner, sporting the “industrial villain” reputation, stands high-fructose corn syrup (HFCS).
But here’s where things get interesting—and where most people’s understanding starts to unravel.
Cane sugar, whether it comes from tropical sugar cane swaying in Caribbean fields or from humble sugar beets growing in North Dakota soil, is chemically identical once refined. It’s pure sucrose—a molecule that sounds simple but hides a fascinating secret. Sucrose is actually two simpler sugars holding hands: one glucose molecule bonded to one fructose molecule in a perfect 50/50 partnership.
Think of sucrose as a married couple entering a nightclub. They arrive together, but once inside (your digestive system), they immediately split up and mingle separately. This isn’t a bitter divorce—it’s just what happens when sucrose meets your digestive enzymes.
High-fructose corn syrup has a more industrial origin story. It begins as corn starch, which undergoes an enzymatic transformation worthy of a cooking show montage. First, the starch breaks down into glucose. Then, through a process called isomerization (imagine a molecular makeover), some of that glucose transforms into fructose.
The result? HFCS comes in two main varieties:
- HFCS-42: About 42% fructose, 58% glucose (used in foods)
- HFCS-55: About 55% fructose, 45% glucose (the soda sweetener)
Notice something? That HFCS-55 in your Coca-Cola is remarkably close to sucrose’s 50/50 split. We’re talking about a 5% difference—less variation than you’d find in the ripeness of two apples from the same tree.
The Journey Through Your Body
What Really Happens When You Sip That Soda
Let’s follow a mouthful of soda—any soda—on its journey through your body. This is where the cane sugar versus HFCS debate starts to look surprisingly… pointless.
When you take that first refreshing sip of a cane sugar-sweetened cola, the sucrose molecules don’t get VIP treatment. They don’t cruise through your digestive system wearing “all-natural” badges. Instead, within minutes of hitting your small intestine, an enzyme called sucrase-isomaltase acts like a molecular bouncer, immediately splitting every sucrose molecule into its component parts: free glucose and free fructose.
The plot twist? By the time these sugars reach your bloodstream, your body literally cannot tell whether they started their journey as sucrose from sugar cane or as the already-separated glucose and fructose in HFCS. It’s like asking someone to identify whether the water in their glass came from rain or melted snow—by the time it’s H₂O, the origin story doesn’t matter.
This digestive reality demolishes one of the most common arguments against HFCS: that the “free” fructose is somehow more harmful than the “bound” fructose in sucrose. Your digestive system laughs at this distinction. That bond in sucrose lasts about as long as a soap bubble in a hurricane once it meets your intestinal enzymes.
But here’s where it gets even more interesting. The glucose and fructose, now separated regardless of their origin, take completely different paths through your body:
Glucose gets the red-carpet treatment. It’s your body’s preferred fuel, quickly absorbed and either used immediately for energy or stored for later. Every cell in your body can use glucose. It’s the universal currency of cellular energy.
Fructose takes a different route—think of it as the scenic backroad that leads primarily to your liver. Unlike glucose, only your liver can process significant amounts of fructose. In moderate amounts, this isn’t a problem. Your liver handles it fine, converting it to glucose, lactate, or storing it as glycogen. But flood your liver with too much fructose too quickly? That’s when things get complicated.
The Science Speaks (And It Might Surprise You)
What Controlled Studies Actually Reveal
Here’s where we separate Instagram nutrition advice from actual science. Researchers haven’t just wondered about HFCS versus sucrose—they’ve put it to the test in controlled trials that would make any skeptic pause.
In 2020, a comprehensive meta-analysis published in Nutrition Reviews examined multiple studies comparing fructose-containing sugars. The researchers asked a simple but crucial question: When you give people the same number of calories from HFCS versus sucrose, what happens to their health markers?
The answer was almost disappointingly boring: no significant differences in weight gain, blood pressure, cholesterol, or blood sugar control. It was like comparing two different brands of gasoline in your car—same fuel, same result.
But scientists didn’t stop there. A 2022 systematic review in Frontiers in Nutrition dug even deeper, analyzing studies that specifically compared HFCS to sucrose. Again, the results were remarkably similar across the board. The only tiny difference they found was in C-reactive protein (a marker of inflammation), which slightly favored sucrose—but the difference was so small that researchers questioned whether it had any real-world significance.
Perhaps most tellingly, a 10-week randomized trial had participants consume beverages sweetened with either HFCS-55 or sucrose at typical American intake levels. Researchers monitored everything from hunger hormones to metabolic markers. The result? Your body’s response was virtually identical regardless of which sweetener you consumed.
Think about that for a moment. Ten weeks of daily consumption—enough time to see real metabolic changes—and the type of sugar didn’t matter. What mattered was the amount.
The Soda Reality Check
Why Your Daily Coca-Cola Is the Real Story
Let’s talk about the elephant in the room—or rather, the polar bear in the soda commercial. Sugar-sweetened beverages aren’t just another source of calories. They’re a unique delivery system for sugar that bypasses many of your body’s natural safety mechanisms.
When you drink a 12-ounce Coca-Cola—whether it’s the American HFCS version or the Mexican cane sugar variety—you’re consuming 39 grams of added sugar. Let that sink in. That’s:
- About 10 teaspoons of sugar
- 78% of your recommended daily sugar intake
- 140-150 calories that don’t make you feel full
- A sugar rush that your liver has to process immediately
The research on sugar-sweetened beverages tells a sobering story:
Diabetes Risk: People who drink 1-2 servings of SSBs daily have a 26% greater risk of developing type 2 diabetes compared to those who rarely drink them. This isn’t just about weight gain—the risk persists even after accounting for obesity.
Heart Disease: A Harvard study following over 40,000 men found that those who averaged one sugary drink per day had a 20% higher risk of heart disease compared to men who rarely consumed such drinks.
The Exercise Myth: Think you can just hit the gym to burn off that soda? Research published in the American Journal of Clinical Nutrition found that even physically active adults who regularly consumed SSBs had increased cardiovascular risk. You can’t outrun a bad diet—especially when it comes in liquid form.
But why are liquid sugars particularly problematic? It comes down to evolution and engineering. Our bodies evolved to handle sugar from whole fruits, where fiber slows absorption and bulk triggers satiety. A large apple contains about 19 grams of sugar but also provides fiber, water, and physical volume that fills you up.
A soda? It’s basically mainlining sugar. You can drink 39 grams of sugar in under a minute, your blood sugar spikes, your liver goes into overdrive, and 20 minutes later, you’re not even full. In fact, studies show that liquid calories don’t suppress hunger hormones the way solid foods do. Your body barely registers that you’ve consumed anything at all.
The Mexican Coke Phenomenon Decoded
Why Taste and Chemistry Tell Different Stories
Ah, Mexican Coca-Cola. The holy grail of soda purists. Served in those distinctive glass bottles, made with “real” cane sugar, and somehow, mysteriously, undeniably better-tasting—or so the legend goes.
But here’s what’s actually happening when you crack open that imported bottle:
The Sugar Content: Despite all the mystique, Mexican Coca-Cola contains virtually the same amount of sugar as its American counterpart—39 grams per 12-ounce serving. From a health perspective, your pancreas doesn’t care about the sugar’s passport.
So why do so many people swear it tastes better? The answer lies not in the sugar itself but in a fascinating interplay of physics, psychology, and packaging:
The Glass Bottle Effect: Glass is chemically inert, meaning it doesn’t interact with the soda at all. Plastic bottles, on the other hand, are slightly porous. Over time, CO₂ escapes through the plastic, reducing carbonation. That glass bottle keeps your Coke fizzier longer, creating a sharper, more refreshing taste experience.
The Aroma Factor: The narrow opening of a glass bottle concentrates aromatic compounds right at your nose as you drink. Since smell contributes enormously to taste perception, this creates a more intense flavor experience. It’s the same reason wine enthusiasts obsess over glass shape.
The Context Effect: There’s something psychologically satisfying about drinking from glass. It feels more premium, more authentic. Studies have shown that our perception of taste is heavily influenced by packaging, branding, and context. That Mexican Coke might taste better partly because you expect it to.
The Temperature Factor: Glass bottles often feel colder in your hand and maintain temperature differently than plastic or aluminum. Temperature dramatically affects taste perception—especially sweetness and carbonation intensity.
One fascinating study had participants taste identical colas from different containers while blindfolded. The preference for glass containers diminished significantly when visual and tactile cues were removed. The “better” taste was as much about the experience as the actual liquid.
The Hidden Fructose Controversy
When Labels Don’t Tell the Whole Story
Here’s where our story takes an unexpected turn into the realm of food science detective work. Some independent laboratories have reported finding fructose levels in certain American soft drinks that exceed the expected 55%—sometimes reaching 60% or even 65%.
If true, this would mean some beverages contain more fructose than their HFCS-55 label suggests. But before you panic, let’s put this in perspective:
The Testing Challenge: Measuring exact fructose-to-glucose ratios in finished beverages is surprisingly complex. Different testing methods can yield different results, and factors like storage temperature and age of the product can affect readings.
The Practical Impact: Even if some sodas contain 60% fructose instead of 55%, we’re talking about a difference of roughly 2 grams of fructose per can. While any mislabeling is concerning from a transparency standpoint, this difference is unlikely to significantly change the health impact of drinking that soda.
The Bigger Picture: Whether a soda contains 55% or 60% fructose, you’re still consuming nearly 40 grams of added sugar. It’s like debating whether you were driving 85 or 90 mph when the speed limit is 55—you’re still speeding.
Decoding the Nutrition Label
Your Practical Guide to Sugar Surveillance
Walking through a grocery store in 2025 is like navigating a minefield of marketing claims. “Natural,” “No HFCS,” “Real Sugar”—the labels scream for your attention. But here’s your decoder ring for what actually matters:
The “Added Sugars” Line: This is your North Star. The FDA requires manufacturers to list added sugars separately from naturally occurring sugars (like those in milk or whole fruit). The % Daily Value is based on 50 grams per day for a 2,000-calorie diet.
The Many Faces of Sugar: Manufacturers have become creative with naming. Here’s what you might see:
- Evaporated cane juice (fancy name for sugar)
- Brown rice syrup (still sugar)
- Agave nectar (actually higher in fructose than HFCS)
- Coconut sugar (metabolically identical to regular sugar)
- Fruit juice concentrate (concentrated sugar)
The 78% Reality Check: Remember that 12-ounce soda with 39 grams of sugar? That’s 78% of your daily value gone in one drink. To put this in perspective:
- A Starbucks Caramel Frappuccino (16 oz): 54g of sugar (108% DV)
- A “healthy” smoothie from popular chains: Often 50-70g of sugar
- That “natural” lemonade: Usually 30-40g per bottle
The Serving Size Shell Game: Always check serving sizes. That “innocent” bottled tea might list 25g of sugar, but the bottle contains 2.5 servings. Suddenly you’re looking at 62.5g if you drink the whole thing—which most people do.
What Health Organizations Actually Say
The Unified Front Against Excess Sugar
Here’s something remarkable: Despite their different focuses and constituencies, major health organizations worldwide have reached nearly identical conclusions about sugar intake. They don’t distinguish between cane sugar and HFCS because the evidence doesn’t support treating them differently.
U.S. Dietary Guidelines (2020-2025):
- Limit added sugars to less than 10% of daily calories
- For a 2,000-calorie diet, that’s 50 grams or about 12 teaspoons
- Children under 2: ZERO added sugars recommended
American Heart Association (even stricter):
- Women: No more than 25 grams (6 teaspoons) per day
- Men: No more than 36 grams (9 teaspoons) per day
- Children: 12-25 grams depending on age
World Health Organization:
- Less than 10% of total energy from free sugars
- Additional benefits below 5% (about 25 grams)
- Specifically mentions dental health benefits at lower intakes
The consensus is crystal clear: the type of sugar matters far less than the amount.
The Real-World Impact
From Molecular Science to Daily Decisions
Let’s translate all this science into what it means for your Monday morning coffee run and Friday night dinner choices.
The Liquid Sugar Trap: The average American gets 36% of their added sugar from beverages. That’s not counting the sugar in actual food. Common culprits:
- Your morning coffee drink (often 30-50g)
- That afternoon energy drink (27-54g)
- The “healthy” juice at lunch (20-40g)
- Evening cocktails with mixers (10-30g per drink)
The Metabolic Cascade: When you regularly flood your system with liquid sugar:
- Your liver converts excess fructose to fat (de novo lipogenesis)
- Triglycerides increase in your blood
- Uric acid levels rise (hello, gout risk)
- Insulin resistance develops over time
- Non-alcoholic fatty liver disease risk increases
The Dental Disaster: Every sip of sugary drink bathes your teeth in acid for about 20 minutes. Sipping a soda over an hour? That’s continuous acid exposure. The bacteria in your mouth throw a party with every sugar molecule, producing acids that erode enamel.
The Addiction Angle: Brain imaging studies show sugar activating the same reward centers as addictive drugs. The more you consume, the more you need for the same satisfaction—a phenomenon called tolerance. That daily soda becomes two, then three.
Practical Strategies for the Real World
Your Action Plan for Sugar Sanity
Knowledge without action is just trivia. Here’s how to apply what you’ve learned:
The Gradual Shift Strategy:
- Week 1-2: Replace one daily SSB with water or unsweetened tea
- Week 3-4: Dilute remaining sugary drinks with water or ice
- Week 5-6: Save sugary drinks for special occasions only
- Week 7-8: Discover you don’t miss them as much as you thought
The Flavor Bridge Technique:
If plain water bores you:
- Sparkling water with a splash of real fruit juice (5g sugar vs. 40g)
- Iced tea with gradually decreasing sugar
- Kombucha (watch labels—some have significant sugar)
- Water infused with cucumber, mint, or citrus
The Restaurant Reality Check:
- That “fresh-squeezed” lemonade: 40-60g of sugar
- Sweet tea in the South: Often 50+ grams per glass
- Cocktails with mixers: Sugar bombs in disguise
- “Smoothies” at chains: Often worse than milkshakes
The Label Detective Method:
- Ignore front-of-package claims
- Go straight to “Added Sugars” on the Nutrition Facts
- Check serving size (is it realistic?)
- Remember: 4 grams of sugar = 1 teaspoon
The Global Perspective
How Different Cultures Handle the Sugar Question
The cane sugar versus HFCS debate is largely an American phenomenon, and understanding why reveals much about food systems, economics, and culture.
Europe’s Different Path: The EU has strict production quotas on HFCS (called isoglucose there), limiting it to about 5% of the sweetener market. This isn’t based on health concerns but on protecting their sugar beet industry. Yet European obesity and diabetes rates have been climbing despite using mainly sucrose.
Japan’s Unique Approach: Japan uses HFCS in many products but has some of the lowest obesity rates among developed nations. The difference? Portion sizes and overall consumption patterns. A typical Japanese soda serving is 250-350ml, not the 591ml (20 oz) common in America.
Mexico’s Ironic Twist: Despite being famous for cane sugar Coca-Cola, Mexico has one of the world’s highest soda consumption rates and corresponding health crises. They drink an average of 163 liters per person annually. The type of sugar clearly isn’t protecting them.
The Nordic Model: Countries like Norway and Finland have implemented sugar taxes that don’t distinguish between sugar types—they tax all added sugars equally. The result? Decreased consumption across the board and improving dental health statistics.
The Future of Sweetness
Where Science and Food Technology Are Headed
The cane sugar versus HFCS debate may become obsolete sooner than you think. Here’s what’s on the horizon:
Rare Sugars: Allulose, a natural sugar that tastes like regular sugar but isn’t metabolized the same way. It has 70% of sugar’s sweetness but only 10% of the calories.
Fermentation-Derived Sweeteners: Companies are using precision fermentation to create sweet proteins like brazzein and thaumatin that are thousands of times sweeter than sugar.
Sugar Reduction Technology: New techniques that enhance sweetness perception without adding sugar, using everything from flavor modulators to physical structures that concentrate sweetness on taste buds.
Personalized Nutrition: Continuous glucose monitors and AI-driven apps that show you in real-time how different sugars affect your individual metabolism.
But here’s the crucial point: No technology will save us from overconsumption. Whether it’s cane sugar, HFCS, or some future sweetener, the fundamental challenge remains portion control and mindful consumption.
The Final Verdict: What Really Matters
Cutting Through the Noise to Find Truth
After this deep dive through chemistry labs, research papers, and soda bottles, we arrive at a conclusion that’s both anticlimactic and profound:
The cane sugar versus HFCS debate is a distraction from the real issue: we’re consuming far too much added sugar, period.
It’s like arguing about whether you should smoke filtered or unfiltered cigarettes while ignoring that you’re smoking two packs a day. The delivery system isn’t the primary problem—the dose is.
Here’s what actually matters:
- That 39 grams of sugar in your daily soda is problematic whether it comes from Hawaiian sugar cane or Iowa corn
- Your liver doesn’t care about marketing claims—it processes fructose the same way regardless of source
- The solution isn’t finding “better” sugar—it’s consuming less sugar overall
- The food industry benefits from this debate because it keeps us arguing about the wrong question
The Mexican Coke versus American Coke debate makes for great conversation, but from a health perspective, it’s essentially theological—lots of passion, minimal practical difference.
Your Personal Action Plan
Three Changes That Actually Matter
Forget the cane versus corn debate. Here are three evidence-based changes that will actually impact your health:
1. The One-Drink Rule: If you currently drink multiple SSBs daily, commit to just one. This simple change could cut 20-30 pounds of sugar from your annual diet.
2. The Water-First Protocol: Before any sweetened beverage, drink a full glass of water. You’ll often find the craving disappears, and when it doesn’t, you’ll naturally drink less.
3. The 48-Hour Reset: Go 48 hours with zero added sugars. Not as a permanent lifestyle, but to reset your palate. You’ll be amazed how sweet everything tastes afterward—and how much less sugar you need for satisfaction.
The Ultimate Truth
The cane sugar versus HFCS debate persists because it lets us feel like informed consumers while avoiding the harder truth: modern life has normalized excessive sugar consumption, and switching types is like rearranging deck chairs on the Titanic.
The real revolution isn’t choosing cane over corn—it’s recognizing that a 39-gram sugar bomb is problematic regardless of its agricultural origin. It’s understanding that your body’s biochemistry doesn’t read ingredient labels or care about marketing claims.
The Mexican Coke might indeed taste better. That glass bottle, the different carbonation, the ritual of opening it—these create a superior sensory experience. Enjoy it occasionally, mindfully, as a treat. But don’t fool yourself into thinking the cane sugar makes it healthy.
Because at the end of the day, whether it started as tropical cane swaying in the breeze or Midwestern corn reaching toward the sun, 39 grams of sugar is still 39 grams of sugar. And that’s the only math that matters to your metabolism.
The question isn’t whether cane sugar is better than HFCS. The question is: how much sugar are you really drinking, and what’s it doing to your body? Once you answer that honestly, the path forward becomes remarkably clear.
Choose less. Choose water. Choose health. The rest is just noise.
Remember: This isn’t about perfection or never enjoying a sweet drink again. It’s about awareness, moderation, and making informed choices based on science, not marketing slogans. Your body will thank you—whether you’re team cane sugar or team corn syrup.
References
American Heart Association. (2019). Added sugar is not so sweet.
Centers for Disease Control and Prevention. (2023). Get the facts: Added sugars.
Coca-Cola®. (n.d.). Coca-Cola® original taste: Product facts.
de Koning, L., Malik, V. S., Kellogg, M. D., Rimm, E. B., Willett, W. C., & Hu, F. B. (2012). Sweetened beverage consumption, incident coronary heart disease, and biomarkers of risk in men. Circulation, 125(14), 1735–1741. https://doi.org/10.1161/CIRCULATIONAHA.111.067017
Food and Drug Administration. (2023). Added sugars on the Nutrition Facts label.
Food and Drug Administration. (2020, October 19). The declaration of allulose and calories from allulose on Nutrition and Supplement Facts Labels.
Li, X., Luan, Y., Li, Y., Ye, S., Wang, G., Cai, X., Liang, Y., Kord-Varkaneh, H., & Luan, Y. (2022). The effect of high-fructose corn syrup vs. sucrose on anthropometric and metabolic parameters: A systematic review and meta-analysis. Frontiers in Nutrition, 9, 1013310. https://doi.org/10.3389/fnut.2022.1013310
Mattes, R. D., Jones, J. B., & Lee, J. (2014). Solid versus liquid calories: Current scientific understandings. In Fructose, high fructose corn syrup, sucrose and health (pp. 51–86). Springer. https://doi.org/10.1007/978-1-4899-8077-9_4
Mississippi State Department of Health. (2025). Soft drinks and oral health.
Tappy, L., & Lê, K.-A. (2010). Metabolic effects of fructose and the worldwide increase in obesity. The American Journal of Clinical Nutrition, 91(1), 252S–257S. https://doi.org/10.3945/ajcn.2009.28472D
U.S. Department of Agriculture & U.S. Department of Health and Human Services. (2021). Cut down on added sugars (DGA 2020–2025 fact sheet).
Verspoor, M., & Profaizer, M. (2007). Shelf life of PET bottles estimated via a finite elements method: Simulation of CO₂ and O₂ permeability.
Walker, R. W., Dumke, K. A., & Goran, M. I. (2014). Fructose content in popular beverages made with and without high-fructose corn syrup. Nutrition, 30(7–8), 928–935. https://doi.org/10.1016/j.nut.2014.04.003
World Health Organization. (2015). Guideline: Sugars intake for adults and children.